


2026 Values
Market Trends Report
April 1, 2026
In the interest of openness and transparency, FBCAD is publishing this market trends report summarizing the role of the appraisal district in the property tax system, the real estate market activity affecting your 2026 value, ways property owners can limit their tax liability, as well as resources available to property owners as they navigate the tax rate adoption process.
This report is by no means exhaustive; however, we do hope it conveys useful information to the citizens of Fort Bend County.
Any questions, comments, or concerns, please reach out to info@fbcad.org or give us a call at 281-344-8623.
Table of Contents
Downloads
The Role of the Appraisal District
The Fort Bend Central Appraisal District (FBCAD) plays a pivotal role in the property valuation and taxation process within Fort Bend County. As an independent governmental entity established under Texas law, FBCAD’s primary responsibility is to accurately and equitably appraise all taxable property within the county at market value.
Core Functions and Responsibilities
The Fort Bend Central Appraisal District serves as the cornerstone of the local property tax system through several key functions:
Property Valuation
FBCAD is responsible for determining the market value of all taxable property within Fort Bend County as of January 1st each year — this includes residential, commercial, industrial, land, and business personal property.
Exemption Administration
The district processes and administers various property tax exemptions, including homestead exemptions, over-65 exemptions, disability exemptions, and veterans’ exemptions, among others.
Appraisal Records Maintenance
FBCAD maintains comprehensive records of all property within the county, including ownership information, property characteristics, and valuation history.
Appeals Process Management
The district oversees the property value protest process, allowing property owners to challenge their appraised values through informal meetings and formal hearings before the Appraisal Review Board (ARB).
Tax Roll Certification
After completing the appraisal and appeals processes, FBCAD certifies the appraisal roll to the various taxing entities within Fort Bend County, which then use these values to set their tax rates and collect property taxes.
Organizational Structure and Governance
The Fort Bend Central Appraisal District operates under a specific governance structure designed to ensure fair representation of the county’s taxing entities:
Board of Directors
FBCAD is governed by a board of directors. Five of the directors are appointed by the taxing units that participate in the district. Three directors are popularly elected, and the final director is the elected tax assessor-collector. This board approves the reappraisal plan, approves the district’s budget, and hires the chief appraiser and ARB members.
Chief Appraiser
As the chief administrative officer of the appraisal district, the chief appraiser oversees all operations, including property appraisals, exemption processing, and staff management.
Appraisal Review Board (ARB)
This independent board of citizens appointed by the district’s board of directors resolves disputes between property owners and the appraisal district.
Professional Staff
FBCAD employs professional appraisers, data analysts, mappers, customer service representatives, and administrative staff to carry out its daily operations and responsibilities.
Appraisal Methodology & Standards
The Fort Bend Central Appraisal District adheres to specific methodologies and standards in its appraisal process:
- Market Value Approach: Texas law requires properties to be appraised at their market value as of January 1st each year. Market value is defined as the price a property would sell for on the open market.
- Mass Appraisal Techniques: Due to the large number of properties that must be valued each year, FBCAD utilizes mass appraisal techniques, which involve analyzing market data and applying standardized methods to groups of similar properties.
- Three Approaches to Value: The district employs three standard approaches to determine property values:
- Cost Approach: Estimating the cost to replace a property minus depreciation
- Market Approach: Comparing sales of similar properties
- Income Approach: Analyzing the income-generating potential of commercial properties
- Uniform Standards: FBCAD follows the Uniform Standards of Professional Appraisal Practice (USPAP) and standards established by the International Association of Assessing Officers (IAAO).
- Reappraisal Cycle: The district conducts reappraisals of all property in Fort Bend County every year to ensure values remain current with market conditions.
Relationship with Taxing Entities
The Fort Bend Central Appraisal District maintains important relationships with various taxing entities within the county:
Independent Role
While FBCAD determines property values, it does not set tax rates, impose a levy, or collect taxes. These functions are performed by the individual taxing entities.
Taxing Entities Served
FBCAD provides appraisal services for approximately 260 taxing entities within Fort Bend County, including:
- Fort Bend County
- Towns & Cities within Fort Bend
- School Districts
- Municipal Utility Districts (MUDs)
- Emergency Services Districts
- Special Districts
- Information Sharing: The district provides certified appraisal rolls to these entities, which they use to calculate their tax rates based on their budget needs.
- Funding Mechanism: FBCAD’s operations are funded through assessments paid by the taxing entities it serves, with each entity’s contribution proportional to the tax dollars it levies.
Impact on Property Owners and the Real Estate Market
Impact on Property Owners & Real Estate Market
The Fort Bend Central Appraisal District’s activities have significant implications for property owners and the broader real estate market:
- Half of Tax Calculation: By establishing property values, FBCAD determines the base upon which property taxes are calculated, directly affecting property owners’ tax burdens; however, local government budgets continue to be the driving force behind individual tax levies.
- Market Transparency: Through its property valuation process, the district provides valuable data that contributes to transparency in the local real estate market.
- Appeals Mechanism: FBCAD’s protest process offers property owners a means to challenge valuations they believe are incorrect, ensuring accountability in the appraisal system.
- Exemption Administration: Exemptions can provide significant discounts to individual property owners.
The Fort Bend Central Appraisal District serves as a critical component in the property tax system, balancing its statutory obligation to appraise properties at market value with the need to ensure fairness and equity in the distribution of the tax burden among property owners. Its operations directly impact every property owner in Fort Bend County and play a significant role in shaping the county’s fiscal health and real estate market dynamics.
Introduction
This report serves as a resource for property owners, real estate professionals, policymakers, and investors, providing actionable insights into the current state of Fort Bend County’s real estate market. It is important to note that this report is not exhaustive but rather a summary of what the Fort Bend Central Appraisal District feels are the key market indicators. As appraisers, our role is to review transaction data and create models based on that data. We do not necessarily have a need to answer “Why?” but rather conduct statistical analysis on available data. This report is an attempt to answer the most common question we receive, “Why did my property value go up?”, by putting on an economist’s “hat” to provide insights into the underlying trends and factors affecting property values.
Purpose & Significance
The Fort Bend County real estate market represents a dynamic and evolving sector of the Greater Houston metropolitan area’s economy. As one of the fastest-growing counties in Texas and the United States, Fort Bend County’s real estate landscape offers valuable insights into broader economic trends, demographic shifts, and policy impacts.
This report synthesizes data from multiple authoritative sources and various economic research institutions. By analyzing these diverse data points, we aim to present a holistic view of the Fort Bend County real estate market that goes beyond simple statistics to identify underlying trends, challenges, and opportunities.
Key Market Drivers
Several interconnected factors are currently driving the Fort Bend County real estate market:
Population Growth & Demographic Shifts
Fort Bend County continues to experience significant population growth, with the U.S. Census Bureau estimating the county’s population at approximately 975,191 residents as of 2025 (latest available), representing a 18.5% increase since the 2020 Census. This growth is driven by both domestic migration from other parts of Texas and the United States, as well as international immigration.
The county’s demographic composition is also evolving, with increasing diversity across racial, ethnic, and socioeconomic dimensions. Fort Bend County is now recognized as one of the most diverse counties in the United States, with substantial Asian, Hispanic, Black, and White populations. This diversity influences housing preferences, neighborhood development patterns, and property values throughout the county.
Economic Development & Employment Growth
The diversification of Fort Bend County’s economy beyond its historical agricultural base has created new employment centers and changed commuting patterns, directly impacting residential and commercial real estate demand. Key economic sectors driving growth include:
- Healthcare and life sciences
- Energy and petrochemicals
- Professional and business services
- Education
- Retail and hospitality
- Manufacturing and logistics
Major employers like Texas Instruments, Amazon, Methodist Sugar Land Hospital, and the various school districts provide stable employment bases that support housing demand across different price points.
Fort Bend County demonstrates strong employment metrics and workforce characteristics:
Employment Statistics
- Approximately 479,000 employed population in 2025 [1]
Infrastructure Investment & Development
Significant infrastructure investments have shaped development patterns and property values throughout Fort Bend County:
- Transportation improvements, including expansions to the Grand Parkway (SH 99), Fort Bend Tollway, and various county roads
- Water and wastewater system expansions to accommodate growth
- Educational facilities, including new schools and campuses for Houston Community College and University of Houston
- Healthcare infrastructure, such as hospital expansions and new medical office developments
- Parks, trails, and recreational amenities that enhance quality of life and property values
These investments have opened new areas for development while also increasing the desirability and value of existing neighborhoods with improved connectivity and amenities.
Interest Rates & Mortgage Market Conditions
The mortgage interest rate environment has been a significant driver of real estate market activity. After reaching multi-decade highs in late 2023, mortgage rates eased throughout 2025 and into 2026, influencing both buyer demand and seller behavior:
- Higher rates initially cooled the market from the frenzied pace seen during the pandemic years
- Recent rate moderation has begun to bring some buyers back into the market
- Rate fluctuations have created distinct buyer segments with different motivations and constraints
- Existing homeowners with low-rate mortgages face financial disincentives to sell, contributing to inventory constraints
Housing Supply & Development Patterns
The balance between housing supply and demand remains a critical market driver:
- New construction activity continues to meet housing demand, with notable large-scale residential developments underway such as Austin Point, Indigo, and Brookewater
- Infill development and redevelopment are increasing in established areas like Sugar Land and Missouri City
- Supply chain challenges and labor shortages have impacted construction timelines and costs
- Lot availability and development costs influence new home pricing and market positioning
Regulatory Environment & Policy Changes
Local, state, and federal policies significantly impact the real estate market:
- Property tax legislation at the state level has altered the financial calculations for homeowners and investors
- Local zoning and development regulations shape what can be built and where
- Environmental regulations, particularly related to flooding after Hurricane Harvey, have influenced development patterns
- School district performance and policies affect residential property values and demand patterns
These key drivers interact in complex ways to create the current market conditions in Fort Bend County. Understanding these interactions is essential for interpreting current trends and anticipating future market movements.
Sources: [1] U.S. Census Bureau, Population Estimates Program (PEP), 2024. [2] Fort Bend Economic Development Council. [3] Fort Bend Central Appraisal District (FBCAD), 2026 Market Preview.
Economic Overview in Fort Bend County
Based on the research from multiple authoritative sources, the following information outlines the economic landscape of Fort Bend County, Texas:
Industry Diversity
Fort Bend County boasts a diverse economic base with several key industries driving its growth and development:
Commercial Real Estate Segments
- Office Market: Approximately 12.4 million square feet of office space, with about 400,000 square feet under construction. Nearly 80% of the county’s office inventory is concentrated in the Sugar Land submarket, which serves as the primary hub for professional services and corporate offices.
- Medical Office Properties: Approximately 63% of the office construction pipeline consists of medical office properties, reflecting the growing demand for healthcare facilities in the area.
- Industrial and Flex Properties: Fort Bend County has become a hub for logistics and distribution due to its strategic location near Houston and major transportation corridors. Business parks like Park 8Ninety and Lakeview Business Park attract major companies like Amazon, Home Depot, and FedEx.
- Retail Market: The retail landscape is evolving toward mixed-use projects that integrate retail, office, and residential spaces. Developments like Sugar Land Town Square and the Imperial Market offer vibrant environments that attract residents and visitors.
- Multi-Family and Hospitality: Multi-family developments are clustered in key residential submarkets like Cinco Ranch, Richmond/Rosenberg, and Sugar Land/Missouri City, which are experiencing high population growth.
Key Industries
- Residential construction
- Engineering services
- Healthcare
- Energy
- Logistics and distribution
- Professional services
- Retail and commercial services
Employment Trends
Fort Bend County demonstrates strong employment metrics and workforce characteristics:
- Employment Statistics:
- Approximately 479,000 employed population in 2025 [1]
- Unemployment rate remaining stable at 4.1% as of late 2025 [2]
- Low poverty rate of 7.57% [3]
- Educational Attainment:
- 49.3% of adults have a bachelor’s degree or higher, leading the region [4]
- Strong focus on educational development through collaboration between school districts and higher education institutions
- Workforce Development:
- Active collaboration between educational institutions and industries to meet workforce needs
- Emphasis on healthcare worker training to address shortages in the growing healthcare sector
Sources: [1] Data USA / U.S. Census Bureau, 2024. [2] U.S. Bureau of Labor Statistics / FRED, 2025. [3] Data USA / U.S. Census Bureau ACS, 2024. [4] U.S. Census Bureau, American Community Survey (ACS) 2019-2023.
Infrastructure Investment
Fort Bend County is experiencing significant infrastructure development to support its growing population and economy:
- Healthcare Facilities:
- Memorial Hermann’s $231 million Sugar Land expansion adding a new North Tower by late 2026, alongside a newly announced $282.5 million expansion for the Katy hospital [1]
- Kelsey-Seybold’s new 36,788-square-foot clinic at Fort Bend Town Center completing in 2026 [2]
- Commercial Development:
- Massive industrial and mixed-use projects like the 736,000-square-foot first phase of Hightower Business Park (2026) and Fulshear Central [3]
- Master-planned developments like Austin Point, integrating 14 million square feet of planned commercial space, opening in summer 2025 [3][4]
- Fort Bend Town Center – 50k SF entertainment; 200k SF retail; 50k SF restaurants
- The Grand at Aliana Expansion
- The Oaks of District West – 100-acre mixed-use
- Transportation Infrastructure:
- Significant Houston-Galveston Area Council (H-GAC) mobility investments, including a $114 million Interstate 10 widening through Katy/Brookshire (2026) [5]
- New local capacity projects including a $45 million FM 1093/FM 359 tollway and a $78 million US 90A widening in Fulshear (2025) [5]
- Construction began on $865 million mobility bond
- Major Thoroughfare Plan Amendments
- FBCTRA Toll Road Extensions
- Residential Development:
- Austin Point — 4,700 acres; 14k new homes; 15 million SF mixed-use
- Brookewater — 850-acre; 2,500 new homes
- Indigo — 2,350 acres; “Agrihood”
Sources: [1] Memorial Hermann Health System. [2] Kelsey-Seybold Clinic. [3] REBusinessOnline / Houston Chronicle, Commercial Projects. [4] The Signorelli Co., Austin Point. [5] Houston-Galveston Area Council (H-GAC) 2025-2028 Transportation Improvement Program.
Population Growth
Fort Bend County is experiencing remarkable population growth, making it one of the fastest-growing counties in Texas and the United States:
- Current Population: According to the U.S. Census Bureau, Fort Bend County reached an estimated population of 975,191 as of July 1, 2025 [1].
- Recent Growth:
- 18.3% population increase from April 2020 to July 2025 [1]
- 1.75% growth from 2024 to 2025 (reaching 975,191 residents) [2]
- The population has tripled since 2000 [3]
- Future Projections:
- Expected to reach 1.8 million residents by 2050, according to Woods & Poole estimates
- Demographic Diversity:
- The 5 largest ethnic groups in Fort Bend County are:
- White (Non-Hispanic): 29.8%
- Asian (Non-Hispanic): 21.6%
- Black or African American (Non-Hispanic): 20.3%
- Two+ (Hispanic): 10.3%
- White (Hispanic): 7.23%
- Fort Bend County is recognized as the most diverse county in Texas and the third most diverse in the nation.
- The 5 largest ethnic groups in Fort Bend County are:
Sources: [1] U.S. Census Bureau, Population Estimates Program (PEP), 2024. [2] U.S. Census Bureau / Federal Reserve Economic Data (FRED), 2023. [3] Woods & Poole Economics / Greater Houston Partnership. [4] U.S. Census Bureau, American Community Survey (ACS) Diversity Index estimates.
Economic Indicators
Fort Bend County shows strong economic performance across various indicators:
- Income Levels:
- Median household income: $114,041 (2024 ACS 5-year estimates) [1]
- Continued steady growth in median household income year-over-year [1]
- Property Values:
- Average residential sale price (urban): $470,752 (2026) [2]
- Average residential sale price (rural): $412,770 (2026) [2]
- Year-over-year change: Urban (+2.54%), Rural (-6.66%) [2]
- Business Climate:
- o Favorable environment for business development and expansion [3]
- Strategic location within the Houston metropolitan area
- Business-friendly policies and regulations
Sources: [1] U.S. Census Bureau, American Community Survey (ACS) 5-Year Estimates, 2024. [2] Fort Bend Central Appraisal District (FBCAD), 2026 Market Preview. [3] Fort Bend Economic Development Council.
Impact on Real Estate Market
The economic factors above have significant implications for Fort Bend County’s real estate market:
- Commercial Real Estate Diversity:
- According to Partners Real Estate, multi-family and flex & industrial properties dominate the market, representing 28.8% and 27.9% of total square footage, respectively [1]
- Retail spaces make up 25.3% of the inventory [1]
- Office properties account for 7.4% of the total inventory [1]
- Specialty, retail, and office spaces are also under development, albeit at lower levels
- Construction Activity:
- Multi-family construction leads with over 3 million square feet
- Flex & industrial properties follow closely
- Specialty, retail, and office spaces are also under development, albeit at lower levels
- Market Dynamics:
- Increasing demand for housing options due to population growth
- Growing need for industrial and logistics facilities
- Evolution toward mixed-use developments that integrate multiple property types
- Expansion of healthcare facilities to serve the growing population
Sources: [1] Partners Real Estate, Fort Bend County Commercial Real Estate Report.
The economic landscape of Fort Bend County is characterized by diversity, growth, and strategic development, creating a robust foundation for its real estate market and continued prosperity.
Housing Market Trends in Fort Bend County


Median Home Prices
Fort Bend County’s housing market has shown mixed price trends in recent months:
Current Median Sale Price
- Average sale price for residential property in urban markets: $470,752 (FBCAD, +2.54% YoY)
- Average sale price for residential property in rural markets: $412,770 (FBCAD, -6.66% YoY)
- According to Redfin data, the median home sales price for Fort Bend County increased 2.1% year-over-year to $373,000 in February 2026 [1].
Listing Price vs. Sale Price
- Federal Reserve Economic Data (FRED) shows the median listing price in Fort Bend County at $423,223 as of February 2025 [2].
- The gap between listing and sale prices indicates potential negotiation room in the current market.
Price Trends by Housing Segment
According to the Houston Association of Realtors (HAR), different price segments are performing differently:
- Homes priced between $150,000 and $249,999 saw a 9.1% increase in sales in 2025 [3]
- Luxury homes ($1 million+) experienced a slight decrease of 0.3% over the full year 2025, though early months saw significant surges [3]
- Mid-range homes ($250,000 – $999,999) saw varied activity
This suggests shifting dynamics across the affordability spectrum.
Sources: [1] Redfin, Fort Bend County Housing Market Data, Early 2026. [2] Federal Reserve Economic Data (FRED). [3] Houston Association of Realtors (HAR), 2025 Full-Year Housing Market Update.
Inventory Levels
Fort Bend County is experiencing a significant shift in housing inventory:
Current Inventory
- Active listings in the Greater Houston area, which includes Fort Bend County, reached 31,112 in February 2025.
- This represents a 33.7% increase compared to February 2024 levels.
- According to HAR, this is the highest volume of available homes since July 2011 when there were 32,096 units.
Months of Inventory
- The months of inventory in the area has increased to 4.4 months from 3.3 months in February 2024.
- This indicates a shift toward a more balanced market compared to the seller’s market conditions of recent years.
- For context, the national supply stands at 3.5 months, according to the National Association of Realtors
Inventory by Property Type
- Single-family homes dominate the inventory.
- Townhomes and condominiums have seen inventory expand from a 3.9-months supply in February 2024 to 6.2-months in February 2025, the highest level since June 2012.
New Construction Trends
New construction activity in Fort Bend County continues to respond to market demands:
Construction Activity
- Based on Partners Real Estate data, multi-family construction leads with over 3 million square feet under development [1].
- Residential construction remains one of the key industries in Fort Bend County’s economic base.
Development Patterns
- New construction is clustered in key residential submarkets like Cinco Ranch, Richmond/Rosenberg, and Sugar Land/Missouri City.
- Mixed-use master-planned developments like Austin Point are emerging as significant contributors to new housing stock [2].
Future Projections
- With Fort Bend County’s population expected to reach 1.8 million by 2050, continued new construction will be necessary to meet housing demands.
- Notable residential projects include Austin Point (4,700-acre), Indigo (235-acre), and Brookewater (850-acre) [2].
By The Numbers
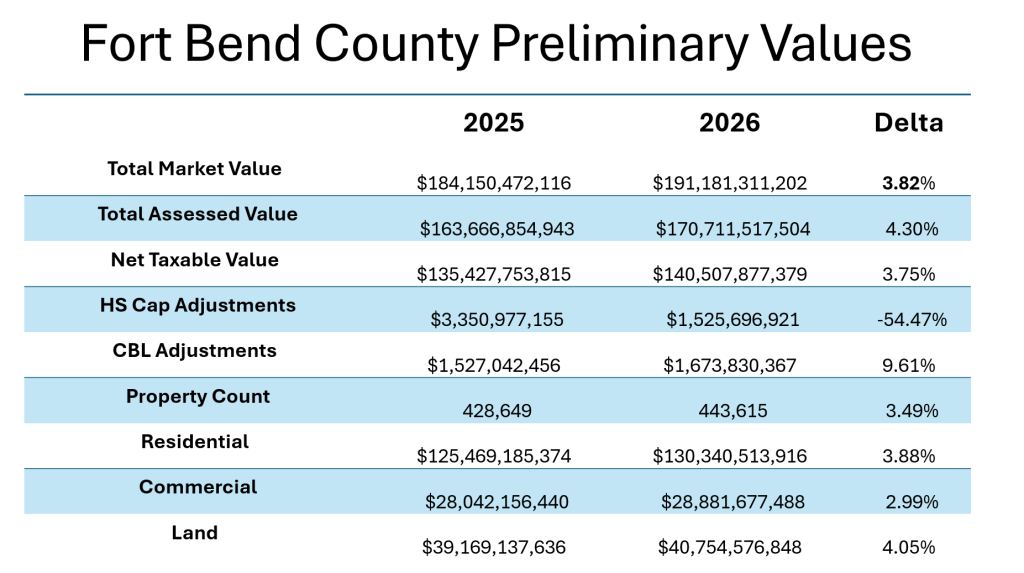
- Residential: 6,486 new homes were added to the appraisal roll in 2026 [2].
- Commercial: Continued growth with $1.01B in taxable value for new construction [2].
Sources: [1] Partners Real Estate, Fort Bend County Commercial Real Estate Report. [2] Fort Bend Central Appraisal District (FBCAD), 2026 Market Preview.
Sales Activity
The broader housing market is demonstrating resilience and growth in transaction volume:
Current Sales Volume
- According to HAR, total property sales for the full year 2025 in the Greater Houston area rose 2.3%, with total dollar volume up 4.5% to $42.9 billion [1].
- Single-family home sales specifically were up 3.8% year-over-year, totaling 88,634 properties sold in 2025 [1].
Sources: [1] Houston Association of Realtors (HAR), December/Full-Year 2025 Housing Market Update.
Commercial & Land Values
Commercial Values
- Commercial value growth was driven largely by significant new construction and slightly lower cap rates [2].
- Retail, warehouses, hotels, and multi-family are holding steady, while the traditional office market saw no new inventory or construction [2].
Land Values
- Land values have increased by an average of around 6% across school districts [2].
- Agricultural use land is declining rapidly, consistent with ongoing development [2].
Days on Market
- Homes in the Greater Houston area, including Fort Bend County, are taking longer to sell, with the Days on Market (DOM) increasing to 64 days for the full year 2025, compared to 59 days in 2024 [1].
Market Dynamics
- The cooling in sales activity is attributed to economic conditions, including earlier elevated mortgage rates and inflation concerns.
- According to HAR Chair Theresa Hill, “The past year brought a welcome sense of balance back to the Houston housing market… Buyers had more choices, prices were more stable and homes continued to sell at a steady pace.” [1]
Sources: [1] Houston Association of Realtors (HAR), December/Full-Year 2025 Housing Market Update. [2] Fort Bend Central Appraisal District (FBCAD), 2026 Market Preview.
Conclusion
Market Trends Report
The Fort Bend County real estate market in 2026 reflects a dynamic environment characterized by steady population growth, diverse economic expansion, and significant infrastructure investments. While the residential housing sector is experiencing a return to a more balanced market—evidenced by increased inventory levels, moderating price appreciation, and longer days on market—overall demand remains robust, driven by a strong local economy and continuous job creation.
Commercial and land sectors also demonstrate resilience, supported by ongoing new construction, particularly in multi-family spaces, medical facilities, and industrial complexes. Although macroeconomic factors such as mortgage interest rates and inflation have tempered the frenzied pace of previous years, Fort Bend County’s strategic development initiatives and expanding workforce continue to set a strong foundation for long-term real estate stability and growth. The Fort Bend Central Appraisal District remains committed to accurately reflecting these market dynamics while ensuring an equitable property tax system for all residents.