


2024 Values
Market Trends Report
In the interest of openness and transparency, FBCAD is publishing this market trends report summarizing the role of the appraisal district in the property tax system, the real estate market activity affecting your 2024 value, ways property owners can limit their tax liability, as well as resources available to property owners as they navigate the tax rate adoption process.
This report is by no means exhaustive; however, we do hope it conveys useful information to the citizens of Fort Bend County.
If you have any questions, comments, or concerns, please reach out to info@fbcad.org or give us a call at 281-344-8623.
Role of the Appraisal District
Appraisal districts were created by the Texas Legislature in 1979. Each appraisal district is governed by a board of directors elected by the local taxing units. The duties and obligations of appraisal districts are set by the Texas Property Tax Code.
Under the law, the Fort Bend Central Appraisal District (FBCAD) is responsible for a number of activities in the Texas property tax system. The activity most associated with the appraisal district is the annual valuation of properties throughout the county.
FBCAD is required to accurately and equitably appraise the market value of all residential, commercial, industrial, and business personal property within our district using standard, well-established, and professional mass appraisal practices.
The appraisal district does not set tax rates or collect taxes. Those activities are conducted by local government offices and school districts across the county.
The Texas Property Tax Code mandates January 1st as the effective valuation date for all of our appraisals. To fulfill this requirement, the appraisal district must collect relevant information from the previous year.
We collect this real-world data from multiple sources including sales transactions, construction costs (materials and labor), replacement costs, income streams and expense data, developer activity, and more. This information is then organized, categorized, and analyzed by way of ratio studies and multiple regression analysis.
The Texas Constitution requires properties to be valued at 100% of their market value. This ensures that all properties are valued fairly and uniformly. Additionally, the appraisal district is not permitted under the law to set a market value of less than 100%. The adjustments we make to values are backed by market data and statistical analysis.
The appraisal district is an apolitical organization committed to valuing properties objectively and free from external influence. Our values must conform to standards set by the Texas Comptroller of Public Accounts, the Uniform Standards of Professional Appraisal Practice, the International Association of Assessing Officers, and other generally accepted appraisal methods and techniques.
Introduction
Fort Bend County boasts a dynamic real estate market shaped by a blend of economic resilience, demographic diversity, rapid growth, and strategic development initiatives. The Fort Bend Central Appraisal District is pleased to present this “market trends” report, offering a summary of what we believe are the key market indicators influencing property values and market dynamics across the county.
Purpose and Significance
This report serves as a resource for property owners, real estate professionals, policymakers, and investors, providing actionable insights into the current state of Fort Bend County’s real estate market. It is important to note that this report is not exhaustive but rather a summary of what the Fort Bend Central Appraisal District feels are the key market indicators. As appraisers, our role is to review transaction data and create models based on that data. We do not necessarily have a need to answer “Why?” but rather conduct statistical analysis on available data. This report is an attempt to answer the most common question we receive, “Why did my property value go up?”, by putting on an economist’s “hat” to provide insights into the underlying trends and factors affecting property values.
Key Market Drivers
Rising interest rates, inflationary pressures, a growing population, and persistently low inventory levels continue to shape the trajectory of Fort Bend County’s real estate market. While the market has shown signs of slowing, the delicate balance between supply and demand remains a critical factor. Despite a gradual increase in inventory and drop in sales volume, the market has not yet reached a state of equilibrium, underscoring the ongoing and sustained demand for real estate in Fort Bend County.
Throughout this report, we will delve into crucial aspects of the local real estate landscape, including economic trends, housing market dynamics, sales activity, property values assessment, and a forward-looking market outlook. Our goal is to empower stakeholders with the knowledge needed to navigate the evolving real estate environment effectively.
Now, let’s proceed to explore the economic overview, housing market trends, and other essential topics to offer a summary view of Fort Bend County’s real estate market.
Economic Overview in Fort Bend County
Fort Bend County’s economic landscape is marked by resilience and diversity, with key industries driving growth and employment opportunities. The following overview highlights the major economic factors shaping the real estate market in Fort Bend County:
Industry Diversity
Fort Bend County boasts a diverse economic base, with key industries including residential construction, engineering services, healthcare, and energy. This diversity contributes to the county’s economic stability and resilience against market fluctuations.
Population Growth
Fort Bend County has experienced significant population growth, ranking in the top 10 for net population increases in the entire United States, according to the March 2024 Census Bureau report. This influx of residents reflects the county’s attractiveness and contributes to the demand for housing and commercial properties.
Employment Trends
The county has experienced steady employment growth, with a focus on job creation in sectors such as healthcare services, education, and professional services. The unemployment rate in Fort Bend County remains relatively low compared to state and national averages, indicating a robust labor market.
https://fred.stlouisfed.org/series/TXFORT5URN
Economic Indicators
Several economic indicators reflect the strength of Fort Bend County’s economy:
Gross Domestic Product (GDP): The county’s GDP has shown consistent growth, fueled by contributions from various industries.
Income Levels: Median household incomes in Fort Bend County are above state and national averages, reflecting a prosperous community.
Business Environment: The county offers a favorable business climate, attracting entrepreneurs and businesses looking to establish a presence in a thriving market.
https://fred.stlouisfed.org/series/GDPALL48157
https://www.census.gov/quickfacts/fact/table/fortbendcountytexas/PST045223
Infrastructure Investments
Fort Bend County has made significant investments in infrastructure, including transportation networks like HWY 99 and many other smaller projects, healthcare facilities, and recreational amenities. These investments enhance the quality of life for residents and contribute to the overall attractiveness of the county for real estate investment.
Impact on Real Estate Market
The strength and diversity of Fort Bend County’s economy, coupled with its population growth, have a direct impact on the real estate market. Economic growth, employment opportunities, and infrastructure investments influence property demand, pricing trends, and market dynamics.
In the next sections of this report, we will delve into specific housing market trends, sales activity, and property values assessment to provide a summary analysis of Fort Bend County’s real estate landscape.
Housing Market Trends in Fort Bend County
Fort Bend County’s housing market reflects a dynamic landscape influenced by economic factors, population growth, and consumer preferences. This section provides an overview of key trends in the housing market:
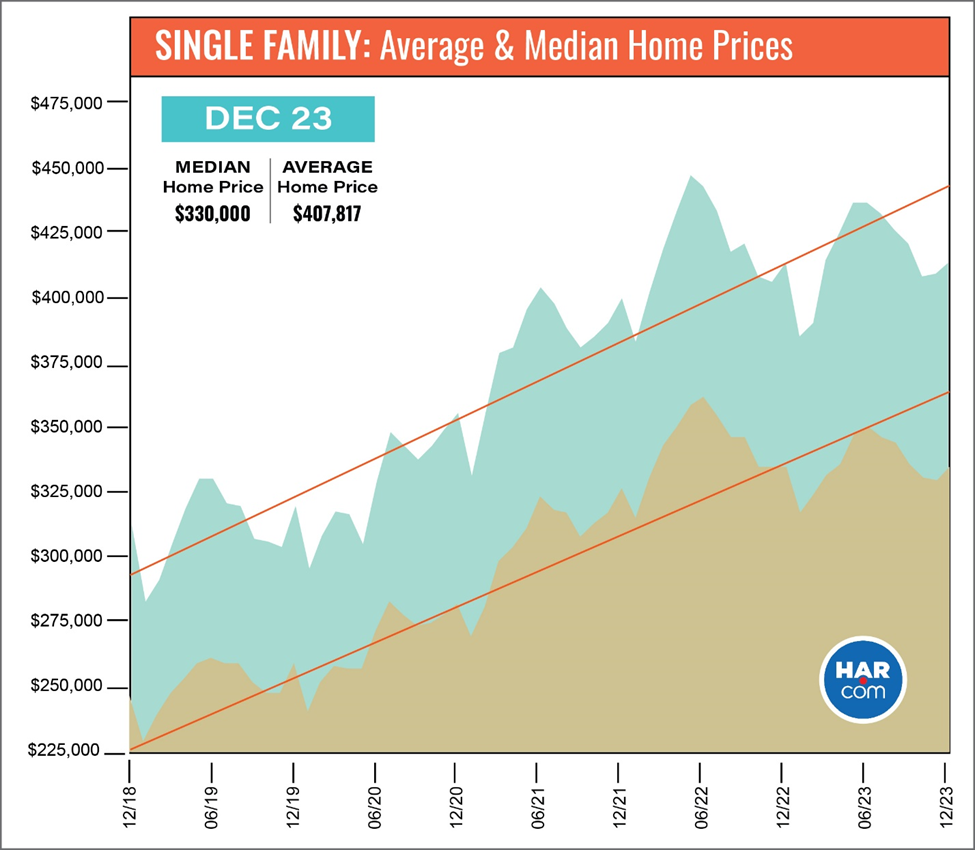
Median Home Prices
Properties with a Homestead Exemption
2023: $463,080
2024: $472,720
+2.08%
Percentage Change
All Residential Properties
2023: $432,520
2024: $449,320
+3.89%
Percentage Change
Source: FBCAD
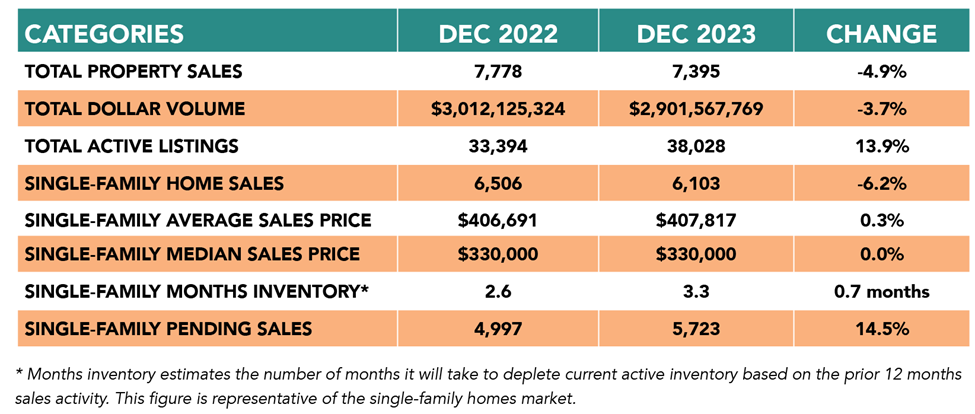
Inventory levels
Inventory levels across the greater Houston area have increased slightly, reflecting weakening demand:
January
2023
2.6
Months of Inventory
January
2024
3.3
Months of Inventory
January 2023 > January 2024
Months of Inventory
+26.92%
Percentage Change
Source: Houston Association of Realtors
New Construction trends
New construction has slowed again for 2024, continuing a downward trend from Fort Bend’s all-time high in 2022.
2022
New Homes Added
+10,083
2023
New Homes Added
+7,422
2024
New Homes Added
+7,360
2022 > 2023
-25.78%
Percentage Change
2023 > 2024
-0.83%
Percentage Change
Source: FBCAD
Sales Activity
The number of home sales in Fort Bend County has remained robust, driven by a combination of factors such as population growth and job opportunities despite inflationary pressures and rising interest rates. Across the greater Houston area, sales dropped from 95,302 to 83,854 homes sold, representing a percentage change of -11.99%.
Note: HAR considers sales activity throughout the greater Houston area which includes Fort Bend, but also many of the surrounding counties. Thus, their numbers don’t exactly align with our data which is Fort Bend specific.
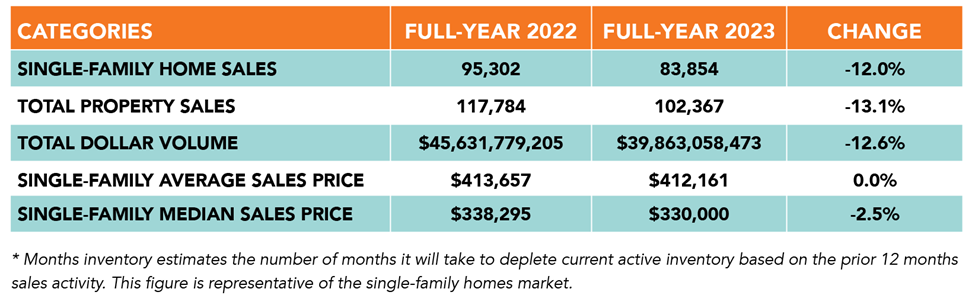
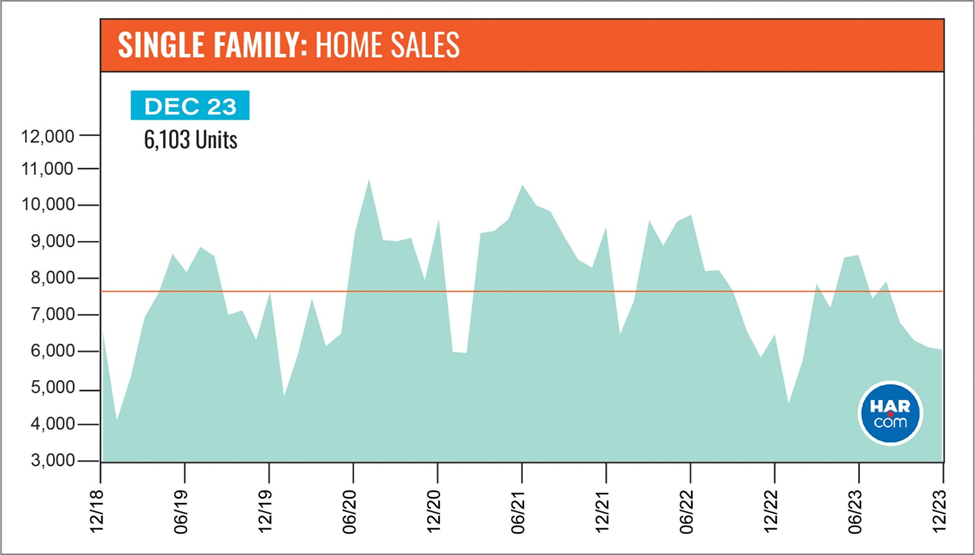
Source: Houston Association of Realtors
Property Types
Fort Bend County’s real estate market encompasses various property types, including:
- Single-family homes
- Condos
- Townhouses
- Luxury properties
- Multi-family properties
- Warehouses
- Retail properties
- Hotels
- Industrial properties
Each property type exhibits unique trends in pricing, demand, and market activity, contributing to the overall market dynamics.
Luxury homes saw the largest year-over-year decline in sales volume on record nationally and a similar trend was observed here in Fort Bend.
Conversely, multi-family properties have surged in demand likely fueled in part by rising interest rates and the increasing difficulty for potential homebuyers to obtain a mortgage.
Source: FBCAD
Impact on Property Values Assessment
Understanding housing market trends is essential for property values assessment. Property appraisers are reactive, analyzing transactions from the previous year and creating models to apply to many properties at once. While it is important to understand why these trends are occurring, FBCAD’s focus is on conducting thorough analyses based on historical data.
In a later section, we will delve deeper into our methodologies, discussing how we interpret market trends, analyze data, and apply valuation models to assess property values accurately.
Property Values Assessment
The assessment of property values in Fort Bend County is influenced by various factors, including market trends, economic conditions, and new developments, but the biggest contributory factor to your property assessment are real life sales of property in the county.
According to HAR, single-family home sales experienced a 6.2 percent decrease in volume, a marked change from the rapid growth of the past few years. The COVID era saw an overheating of the market. The mad dash for single-family homes, complete with bidding wars and frustrated buyers, has begun to subside or even reverse. For the first time in years, new home sellers are once again offering incentives to entice new buyers. This trend indicates a positive shift in the local real estate market, with buyers and sellers finding a more balanced leverage in negotiations.
New developments continue to bring new residents to Fort Bend County, contributing to new growth. In 2023, there were 7,360 newly constructed homes, and many new subdivisions began development, forecasting further growth in 2024.
+4.38%
RESIDENTIAL
Residential property values in Fort Bend County increased from $118,200,825,969 in 2023 to $123,377,240,958 in 2024, representing a percentage change of approximately +4.38%.
+8.90%
COMMERCIAL
Commercial property values also saw an increase, rising from $25,639,111,800 in 2023 to $27,923,375,357 in 2024, indicating a percentage change of approximately +8.90%.
+33.80%
LAND
Total land value increased significantly from $28,452,883,718 in 2023 to $38,074,778,483 in 2024, reflecting a percentage change of approximately +33.80%.
Land appraisers and analysts at the Fort Bend Central Appraisal District conducted multiple in-house studies, including Paired Sales Analysis, Market Trend Analysis, and an Allocation Study, to determine property values. Additionally, the District contracted a third-party appraisal firm to assist with areas of rapid commercial growth, ensuring comprehensive and accurate assessments across the county.
These changes in property values and the meticulous assessment process highlight the dynamic nature and rigorous analysis involved in valuing properties in Fort Bend County.
Source: FBCAD
Reducing Your Property Tax Burden
Homestead
The homestead exemption remains the easiest way to reduce your property taxes by as much as 20%.
We want every property owner to be fully informed as to the various ways they can reduce their property tax burden.
Beyond that, you may be eligible for the over 65, disability, or veterans among others.
In 2020, FBCAD launched a new online exemptions portal that allows for remote submission of exemptions applications and emailed status updates.
The portal can be accessed by visiting https://www.fbcad.org/exemption-application/
Also, a full list of exemptions can be found at www.fbcad.org/fbcad-forms/ under “Homestead Exemptions” and “Miscellaneous Exemptions”
If you want to check to see what exemptions are associated with your property, please search for your account on our website at https://esearch.fbcad.org/
Please note that Texas law prohibits the appraisal district from displaying certain information in order to protect your privacy.
Our Information and Assistance team is on standby to address any exemption questions you may have. Reach them by phone at 281-344-8623 or send an email to info@fbcad.org
Appeals
We have made significant changes to make the online appeals process more transparent and user-friendly.
The value appeal process provides another avenue for reducing your property’s value, which may reduce your overall tax burden. You know your property best and may have additional information specific to your property or market area that supports a change in value. For this reason, the state legislature created the protest process to officially appeal the value set by the appraisal district. For more information, please visit the “Appeals” section of this website at www.fbcad.org/appeals/
Appealing your value can be a nerve-racking experience. Recognizing this, the Texas Comptroller has produced a set of videos that provide an overview of the protest process for individual homeowners and small businesses. The videos also cover the most common situations that arise in a protest hearing. We host these videos here at www.fbcad.org/property-tax-videos/
Legislative Updates
Recent Legislation Limits Tax Increases
In 2019, the Texas legislature capped the revenue counties and cities can collect. Most taxing entities are limited to a 3.5% increase without needing voter approval. School districts, which typically represent the largest portion of your overall tax bill, are capped at 2.5%. This means that the taxing entities will be required to lower tax rates unless they want to seek voter approval for more. So, your value may have increased, even substantially, but the taxing entities are limited in their ability to raise taxes.
Constitutional Amendments Passed
Property owners should also be aware of two new constitutional amendments that were approved by voters in 2022.
The first increases the homestead exemption to $40,000 (previously $25,000), thereby reducing the individual homeowners tax burden for 2022 (This change only applies to your school district taxes).
FBCAD has already implemented this change as reflected on your most recent tax statement.
The second constitutional amendment approved by voters limits value increases for elderly and disabled homeowners. The author of the law states, “This amendment [reduces] the approximate 2 million exemption holders’ school tax bill, on average, $110 the first year and by $124 the second year.”
Voters Approve Reform
In 2023, voters approved the property tax reform passage passed by the Texas Legislature. This had several positive affects for property owners:
- Increased the homestead exemption for school districts from $40,000 to $100,000.
- Allowed the state to buy-down school district tax rates (compression)
- Started a 3-year trial to cap non-homesteaded properties at 20% per year
- Created 3 new popularly-elected CAD board seats
Homestead Cap
Although the market value set by the appraisal district reflects what similar properties are selling for, many property owners with a homestead exemption will find that their appraised value is capped at a 10% increase. This is meant to protect homeowners from rapidly increasing values such as we’re seeing again this tax year.
For example, if your home was valued at $100,000 in 2023 and the market value increased to, say, $120,000, the homestead cap would limit the increase to $110,000. If you multiply your 2023 appraised value by 1.1, you’ll find the maximum value that your property can be taxed at with your homestead exemption in 2024.
Although residential values are rising just a few percentage points this year, many property owners will still see a 10% increase in the appraised value of their home. In previous years, values were appreciating on average 25% a year, but were capped at 10%. 2024 will be a “cap catch-up” year for many property owners.
Property Tax Transparency Website
Appraisal values are just one part of the property tax equation. The other main factor impacting your property tax amount is the rate set by the local taxing entities in the fall of each year.
Property owners are invited every year to get involved in this process.
In order to provide the community with additional information on the tax rate adoption process, FBCAD created a property tax transparency website.
The goal of this truth-in-taxation website is to increase transparency in the property tax system while educating the public on the tax rate adoption process.
Visit www.fortbendtax.org for more.
Summary
Sales volume is down but values remained flat in the greater Houston area. In Fort Bend, values are slightly up, demonstrating continued local demand.
Land value is up significantly, reflecting incredible demand and continued development in Fort Bend.
2024 will be a “homestead cap catch-up” year for many property owners.
Market value is up slightly, but appraised values will jump 10% for many.
The real estate market is getting closer to equilibrium.
FBCAD Accolades
- 2023 Top Houston Workplace (Houston Chronicle)
- 2023 Winner of IAAO Public Information Program Award
- 2022 Winner of the IAAO Certificate of Excellence in Assessment Administration Award
- 2023 MAP Review Score of (99%)
- 2022 School District Property Value Study Score (98%)