


2023 Values
Market Trends Report
In the interest of openness and transparency, FBCAD is publishing this market trends report summarizing the role of the appraisal district in the property tax system, the real estate market activity affecting your 2023 value, ways property owners can limit their tax liability, as well as resources available to property owners as they navigate the tax rate adoption process.
This report is by no means exhaustive; however, we do hope it conveys useful information to the citizens of Fort Bend County.
If you have any questions, comments, or concerns, please reach out to info@fbcad.org or give us a call at 281-344-8623.

Role Of The Appraisal District
Appraisal districts were created by the Texas Legislature in 1979. Each appraisal district is governed by a board of directors elected by the local taxing units. The duties and obligations of appraisal districts are set by the Texas Property Tax Code.
Under the law, the Fort Bend Central Appraisal District (FBCAD) is responsible for a number of activities in the Texas property tax system. The activity most associated with the appraisal district is the annual valuation of properties throughout the county.
FBCAD is required to accurately and equitably appraise the market value of all residential, commercial, industrial, and business personal property within our district using standard, well-established, and professional mass appraisal practices.
The appraisal district does not set tax rates or collect taxes. Those activities are conducted by local government offices and school districts across the county.
The Texas Property Tax Code mandates January 1st as the effective valuation date for all of our appraisals. To fulfill this requirement, the appraisal district must collect relevant information from the previous year.
We collect this real-world data from multiple sources including sales transactions, construction costs (materials and labor), replacement costs, income streams and expense data, developer activity, and more. This information is then organized, categorized, and analyzed by way of ratio studies and multiple regression analysis.
The Texas Constitution requires properties to be valued at 100% of their market value. This ensures that all properties are valued fairly and uniformly. Additionally, the appraisal district is not permitted under the law to set a market value of less than 100%. The adjustments we make to values are backed by market data and statistical analysis.
The appraisal district is an apolitical organization committed to valuing properties objectively and free from external influence. Our values must conform to standards set by the Texas Comptroller of Public Accounts, the Uniform Standards of Professional Appraisal Practice, the International Association of Assessing Officers, and other generally accepted appraisal methods and techniques.

National Vs. Local
National News
Housing Market Predictions For 2023: Are Home Prices Finally Becoming Affordable?
FORBES – FEBRUARY 2023
“…many economists remain mixed about how much more home prices will drop this year [from their mid-2022 high].”
YAHOO NEWS – JANUARY 2023
“The new year is looking to be rife with challenges for both buyers and sellers, as mortgage rates are expected to go up even more before they go back down.”
Housing Market Momentum Stalls as Critical Spring Season Approaches – WSJ (3/2023)
WALL STREET JOURNAL – MARCH 2023
“…Investors bought nearly one in seven homes sold in America’s top metropolitan areas, the most in at least two decades…”
“Rising mortgage rates cooling the U.S. housing market, sapping recent buyer interest heading into the crucial spring selling season.”
Bad news for home buyers: Housing inventory remains low in America’s cities and towns
MARKET WATCH – MARCH 2023
“Low inventory continues to plague local housing markets. Even with mortgage rates above 6%, an underlying supply imbalance is impacting residential real estate in cities and towns across America…”
Texas Real Estate Research Center
Things Change — December 2022
• Recently, home prices have grown more than four times faster than the 2012-19 annual trend of 5.27 percent.
• Through pandemic, buyers wanted newer homes. Now stabilized to past trends.
• Median square footage of purchased homes down significantly
Texas Housing Affordability Outlook — March 2023
“Although home price appreciation declined substantially from record highs observed in the first two years of the COVID-19 pandemic, year-over-year (YOY) growth in both the median and first-quartile sales price remained positive…”
Fort Bend County Sales & Price Trends

Local News
MLS Press Releases and Archive – HAR members
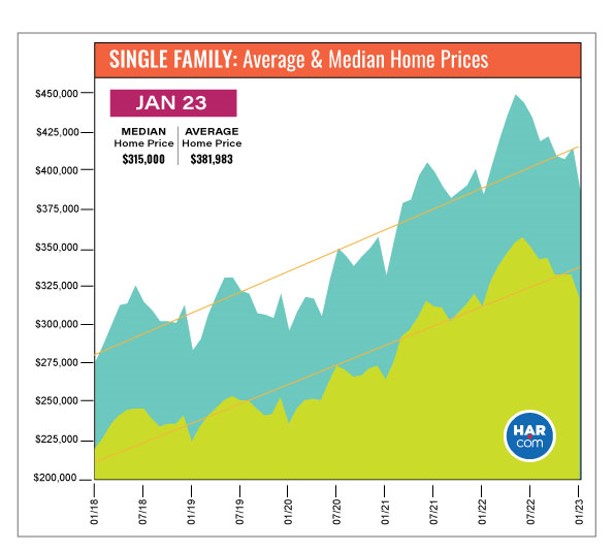
HAR.COM — January 2023
“January became the tenth consecutive month of negative sales, as the market recovers from strong economic headwinds, including inflation, elevated interest rates, pricing and lower inventory.”

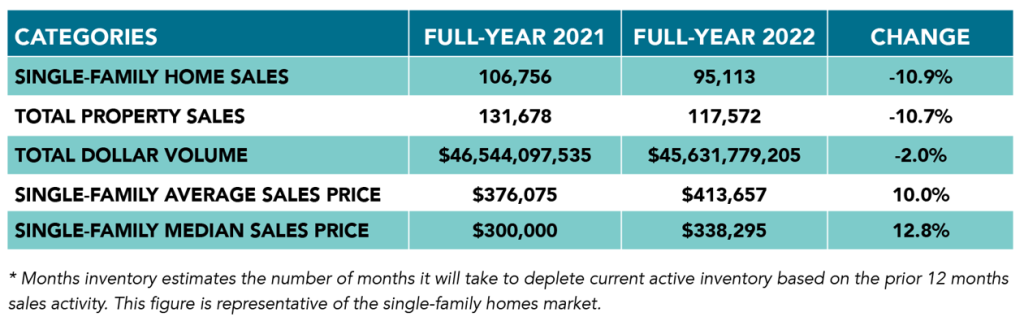
Total property sales, dollar volume, and home sales all down around 30%, according to HAR.
Inventory creeping up.
Editor’s note: It’s important to note that the numbers HAR provides differs from how FBCAD develops its numbers. HAR is looking at sales activity in the greater Houston area while FBCAD considers every property in Fort Bend County.
MLS Press Releases and Archive – HAR members
HAR.COM — January 2023
MLS Press Releases and Archive – HAR members
HAR.COM — January 2023
Fort Bend County is becoming an economic powerhouse. Does it even need Houston?
Houston Chronicle — December 2022
“Employment in Sugar Land jumped 14 percent from 2015 to 2020 — twice the national rate — even as its population grew by less than 2 percent…
Fort Bend is one of the fastest-growing counties in America, and arguably its most diverse. It ranks among the state’s leaders in median household income and educational attainment.”
Houston real estate market struggles to maintain momentum
Houston Agent Magazine — August 2022
“The frenetic pace of home sales that dominated the Houston housing market throughout most of the pandemic continues to “slow its roll,”
Some consumers, facing record pricing, rising interest rates and limited inventory, have moved to the sidelines or opted to rent. As a result, home sales experienced their fourth consecutive monthly decline in July, while new listings buoyed inventory to the highest level in two years.
The scorching pace of Houston housing throughout most of the pandemic was completely unsustainable, so the cooling that we have experienced over the past four months was expected and is all part of a market normalization”
Almost 60% of Houston households can’t afford to buy a home here, report finds
Houston Chronicle — November 2022
“Only about 41 percent of households in the Houston area earned sufficient income to purchase a median-priced home in the third quarter
…it is considerably worse than a year ago, when 53 percent of households could afford to purchase a median-priced home in the area.
Stafford… [was] the most affordable [area] in … Fort Bend…”

Residential Property
Key Market Drivers – Residential
- Inventory Remains Low
- Demand Steady
- Rising Inflation
- Rising Interest Rates
- Continued Supply-Chain Challenges
- Persistent Labor Shortages
- War
The real estate market in the greater Houston area saw the highest sales volume and prices ever recorded. That is, until mid-2022.
The question many observers are asking now: Did 2022 see the peak of the COVID-19 real estate boom?
The trends observed over the last few years seemed to have found their reversal. By the end of the year, sales volume was down significantly. Interestingly, year-over-year prices increased in many areas as demand was stable.
There were several key factors that contributed to this reversal:
- Inventory still low: In recent years, builders ramped up production to catch up with demand and to capture some of the boom in prices. The market is now cooling as many of these new homes are entering the market, forcing some builders to slash prices and offer special deals. Despite this activity, inventory is still low nationwide. Before, homes were selling on average within 0-2 months, but now the market is stabilizing to 3+ months. If it holds, this stabilization will mark a return to a balanced market.
- Demand steady: Demand for real estate has taken a hit, with sales volume down 30% in some areas; however, despite inflation and rising interest rates, buyers are still paying top-dollar for real estate into 2023.
- Rising inflation: The stimulus dollars that helped so many through the pandemic dried up and the effects of that monetary expansion became more apparent. The purchasing power of the dollar took a big hit as the cost of goods and services increased.
- Rising interest rates: The Federal Reserve took steps to combat inflation and cool-down the market by raising interest rates. New mortgages took a nosedive while many buyers, already locked into historically low interest rates from the last few years, saw no incentive to move. Rates are expected to climb even higher.
- Continued supply-chain challenges: The COVID-19 pandemic and response shifted the way people buy and sell. Driver shortages, lack of capacity, inflation, shipping delays, increased freight costs, depleted inventory, labor shortages, and several other issues continued to plague employers and those focused on logistics.
- Persistent labor shortages: As many as 3 million fewer Americans are participating in the labor force since the start of the pandemic in 2020. In the same time frame, job openings nation-wide have nearly doubled.
- War: Although reasonable economists recognized that rising inflation was already an emerging trend, the war in Ukraine created additional inflationary pressures particularly in energy and food.
2022 NOTICE VALUE
$100,110,819,216
2023 NOTICE VALUE
$115,636,968,174
DIFFERENCE IN VALUE BETWEEN YEARS
+15.5%
HOMESTEAD PROPERTIES UP AVG.
14.76%
(NV) Notice Value by School District
2022 (NV)
$100,110,819,216
| School District | Lamar | Brazos | Needville | Ft. Bend | Stafford | Katy |
|---|---|---|---|---|---|---|
| Improvement Value | $20,773,260,869 | $140,711,130 | $1,220,149,901 | $43,935,407,939 | $840,620,655 | $17,701,807,784 |
| Land Value | $4,178,342,426 | $39,381,290 | $329,814,480 | $7,921,138,099 | $123,091,701 | $2,907,092,942 |
| Total Mkt Value | $24,951,603,295 | $180,092,420 | $1,549,964,381 | $51,856,546,038 | $963,712,356 | $20,608,900,726 |
2023 (NV)
$115,636,968,174
| School District | Lamar | Brazos | Needville | Ft. Bend | Stafford | Katy |
|---|---|---|---|---|---|---|
| Improvement Value | $25,259,780,507 | $170,550,289 | $1,293,976,244 | $50,867,643,179 | $950,964,228 | $20,493,455,896 |
| Land Value | $4,649,194,238 | $66,169,802 | $489,516,605 | $8,334,372,544 | $129,478,785 | $2,931,865,857 |
| Total Mkt Value | $29,908,974,745 | $236,720,091 | $1,783,492,849 | $59,202,015,723 | $1,080,443,013 | $23,425,321,753 |
Fort Bend County Residential Value Trends
The 2023 tax year saw a 26% overall decrease in new construction activity. Tax year 2022 saw the largest increase in residential inventory FBCAD has ever seen, around 10,000 new homes. This year, those are down to pre-pandemic numbers or about 7,400 homes.
For tax year 2022, the overall change in value for a residential property is an increase of 15.5%.
Properties with a homestead exemption will see an average increase in market value of 14.76%.
It’s important to note that FBCAD utilizes generally accepted appraisal practices when developing values. All valid market transactions (“comparables” or “comps”) are considered when building the appraisal model for a given neighborhood. The goal of our models is to achieve a median sales ratio and valuation ratio of 100%. For reference, the sales ratio is determined by dividing the appraised value by the sale price.
The homestead exemption remains the best way to save up to 20% on your property taxes. Review the “Reducing Your Property Tax Burden” section below for more details.
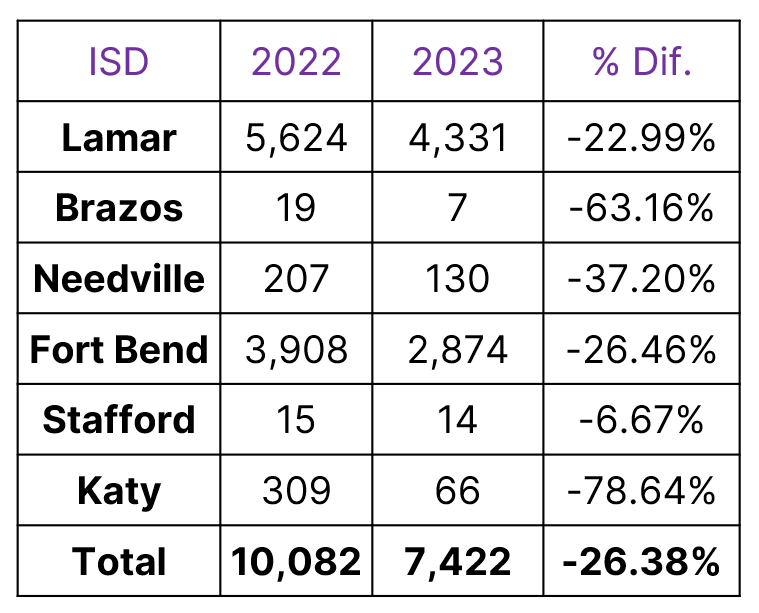
- The 2022 tax year saw a 26% decrease in new construction.
- On the year, Fort Bend County added 7,422 new construction properties, a sharp decline from the past few years.
- Builder costs continue to rise
- Although still low, inventory levels are increasing with homes staying on the market for longer periods of time
- Sales volume is down, but values are stable and increasing across Fort Bend County.

Commercial Property
Key Market Drivers – Commercial
- Increased Construction Costs (Materials & Labor); Inflation
- Increase In Land Values (Scarcity, Demand, etc.)
- Continued Development Due To Interest & Recent Trends In Fort Bend
- Post-Pandemic — Shifting Priorities
Although value is up year-over-year in the commercial space, growth appears to be segment specific.
Commercial property is affected by many of the same factors affecting residential property although is particularly affected by labor shortages and supply chain disruptions.
Some pandemic era trends have continued. Work from home accommodations have become a fixed benefit for many workers resulting in a need for better work from home amenities. This continues to have a negative effect on the value of traditional office space. Class A and B are down 7% and 10%, respectively.
In retail, growth is steady despite continued trends with e-commerce. Values are up on average 7%.
With warehouses, distribution and self-storage warehouses are up 12% and 7%, respectively, while industrial flex spaces are down an average of 10%.
Apartments have also seen a year-over-year increase of around 12%. Rising interest rates and higher prices in the residential market mean less people can afford to purchase a home. Occupancy of multi-family properties is on the rise.
Hotels have taken the biggest year-over-year drop in value, down on average 17% from last year.
New construction in commercial property remained steady with 238 new properties added to the roll for 2023. Last year, FBCAD added 241 commercial properties to the appraisal roll.
Overall, commercial property is increasing 18% from last year’s notice value.
Retail
Retail models overhauled for 2023
Cap rates reflect uncertainty
Overall average increase is 7%
Warehouses
Warehouse performance mixed
Distribution warehouses up an average 12%
Industrial flex down an average 10%
Self storage up an average 7%
Industrial Market “Surges” Into 2023
Largely Driven By Distribution Centers

Offices
Offices valued on income
Class A down on average 7%
Class B down on average 10%
Cap rates reflect office trend changes
Multi-Family
Demand for Class B and C down while demand for Class A is up
9 new apartments for 2023
Overall increase of 12%
Hotels
Down 17% from 2022
Cap rates are up
3 hotels added in 2023
2022 NOTICE VALUE
$20,657,921,150
2023 NOTICE VALUE
$24,477,112,401
DIFFERENCE BETWEEN YEARS
+18.48%
(NV) Notice Value by School District
2022 (NV)
$20,657,921,150
| School District | Lamar | Brazos | Needville | Ft. Bend | Stafford | Katy |
|---|---|---|---|---|---|---|
| Improvement Value | $3,135,973,388 | $56,066,323 | $70,454,466 | $9,225,390,531 | $2,061,000,861 | $3,199,425,794 |
| Land Value | $782,198,670 | $8,863,440 | $24,916,380 | $1,786,170,860 | $385,049,250 | $758,785,240 |
| Total Mkt Value | $3,918,172,058 | $64,929,763 | $95,370,846 | $11,011,561,391 | $2,446,050,111 | $3,958,211,034 |
2023 (NV)
$24,477,112,401
| School District | Lamar | Brazos | Needville | Ft. Bend | Stafford | Katy |
|---|---|---|---|---|---|---|
| Improvement Value | $3,763,948,574 | $64,626,817 | $81,394,496 | $10,629,618,546 | $2,424,471,229 | $3,448,721,223 |
| Land Value | $860,227,221 | $10,907,921 | $31,048,380 | $1,911,654,164 | $447,577,769 | $802,916,061 |
| Total Mkt Value | $4,624,175,795 | $75,534,738 | $112,442,876 | $12,541,272,710 | $2,872,048,998 | $4,251,637,284 |
New Construction
The commercial division added over 238 new construction properties for 2023. A slight decrease from 2022 (241)
Most of the new construction is in Lamar CISD, Fort Bend ISD, and Katy ISD
9 new apartments
1 new traditional office
Continued interest in FB County

Land Development
Although slowed from last year’s boom, land development in Fort Bend County continued to show strength into the new year.
Past trends of development along the I-69 and I-10 corridors continued.
Year-over-year land across the county will see an average 7% increase with the biggest increases in the Brazos ISD area.
- Average increase in land value is about 7%
- Strong commercial sales along 59
- Low inventory, demand steady

Reducing Your Property Tax Burden
Homestead
The homestead exemption remains the easiest way to reduce your property taxes by as much as 20%.
The homestead exemption remains the easiest way to reduce your property taxes by as much as 20%.
We want every property owner to be fully informed as to the various ways they can reduce their property tax burden.
Beyond that, you may be eligible for the over 65, disability, or veterans among others.
In 2020, FBCAD launched a new online exemptions portal that allows for remote submission of exemptions applications and emailed status updates.
The portal can be accessed by visiting https://www.fbcad.org/exemption-application/
Also, a full list of exemptions can be found at www.fbcad.org/fbcad-forms/ under “Homestead Exemptions” and “Miscellaneous Exemptions”
If you want to check to see what exemptions are associated with your property, please search for your account on our website at https://esearch.fbcad.org/
Please note that Texas law prohibits the appraisal district from displaying certain information in order to protect your privacy.
Our Information and Assistance team is on standby to address any exemption questions you may have. Reach them by phone at 281-344-8623 or send an email to info@fbcad.org
Appeals
We have made significant changes to make the online appeals process more transparent and user-friendly.
We have made significant changes to make the online appeals process more transparent and user-friendly.
The value appeal process provides another avenue for reducing your property’s value, which may reduce your overall tax burden. You know your property best and may have additional information specific to your property or market area that supports a change in value. For this reason, the state legislature created the protest process to officially appeal the value set by the appraisal district. For more information, please visit the “Appeals” section of this website at www.fbcad.org/appeals/
Appealing your value can be a nerve-racking experience. Recognizing this, the Texas Comptroller has produced a set of videos that provide an overview of the protest process for individual homeowners and small businesses. The videos also cover the most common situations that arise in a protest hearing. We host these videos here at www.fbcad.org/property-tax-videos/
Impact of COVID-19 on Appraisal Values
With the pandemic mostly in the rear view mirror, several trends have emerged as a new normal.
The supply-chain, labor, and other logistical issues that arose out of the pandemic have persisted as have inflated real estate values.
The mid-year reversal of the market radically impacted the volume of sales activity throughout the county; however, sales volume is only down to 2019 levels and prices are remaining steady – for now.
Homestead Cap
Although the market value set by the appraisal district reflects what similar properties are selling for, many property owners with a homestead exemption will find that their appraised value is capped at a 10% increase. This is meant to protect homeowners from rapidly increasing values such as we’re seeing again this tax year.
For example, if your home was valued at $100,000 in 2022 and the market value increased to, say, $120,000, the homestead cap would limit the increase to $110,000. If you multiply your final 2022 value by 1.1, you’ll find the maximum value that your property can be taxed at with your homestead exemption in 2023.
Recent Legislation Limits Tax Increases
In 2019, the Texas legislature capped the revenue counties and cities can collect. Most taxing entities are limited to a 3.5% increase without needing voter approval. School districts, which typically represent the largest portion of your overall tax bill, are capped at 2.5%. This means that the taxing entities will be required to lower tax rates unless they want to seek voter approval for more. So, your value may have increased, even substantially, but the taxing entities are limited in their ability to raise taxes.
Constitutional Amendments Passed
Property owners should also be aware of two new constitutional amendments that were approved by voters in 2022.
The first increases the homestead exemption to $40,000 (previously $25,000), thereby reducing the individual homeowners tax burden for 2022 (This change only applies to your school district taxes).
FBCAD has already implemented this change as reflected on your most recent tax statement.
The second constitutional amendment approved by voters limits value increases for elderly and disabled homeowners. The author of the law states, “This amendment [reduces] the approximate 2 million exemption holders’ school tax bill, on average, $110 the first year and by $124 the second year.”
Property Tax Transparency Website
Appraisal values are just one part of the property tax equation. The other main factor impacting your property tax amount is the rate set by the local taxing entities in the fall of each year.
Property owners are invited every year to get involved in this process.
In order to provide the community with additional information on the tax rate adoption process, FBCAD created a property tax transparency website.
The goal of this truth-in-taxation website is to increase transparency in the property tax system while educating the public on the tax rate adoption process.
Visit www.fortbendtax.org for more.
Summary
2022 saw the highest residential values ever recorded in Fort Bend history before a mid-year reversal calmed the market.
Sales volume is down across the board, but prices remained steady or slightly increased for higher end homes. Lower end homes had plenty of demand and larger increases in value.
Commercial market performance was segment specific. Hotels and high-end offices are down while multi-family, retail, and medical office are up. Warehouse performance was mixed depending on type.
Fort Bend County continues to be among the fastest growing counties in the state.
FBCAD Activities
- All School Districts Passed 2022 Property Value Study in a Tough PVS Year (Overall 98%)
- Awarded IAAO Certificate in Excellence for Assessment Administration in 2022
- 2021 Methods and Assistance Review (99%)
- Named Top Houston Workplace in 2022