


2025 Values
Market Trends Report
In the interest of openness and transparency, FBCAD is publishing this market trends report summarizing the role of the appraisal district in the property tax system, the real estate market activity affecting your 2024 value, ways property owners can limit their tax liability, as well as resources available to property owners as they navigate the tax rate adoption process.
This report is by no means exhaustive; however, we do hope it conveys useful information to the citizens of Fort Bend County.
Any questions, comments, or concerns, please reach out to info@fbcad.org or give us a call at 281-344-8623.
Table of Contents
Downloads
The Role of the Appraisal District
The Fort Bend Central Appraisal District (FBCAD) plays a pivotal role in the property valuation and taxation process within Fort Bend County. As an independent governmental entity established under Texas law, FBCAD’s primary responsibility is to accurately and equitably appraise all taxable property within the county at market value.
Core Functions and Responsibilities
The Fort Bend Central Appraisal District serves as the cornerstone of the local property tax system through several key functions:
Property Valuation
FBCAD is responsible for determining the market value of all taxable property within Fort Bend County as of January 1st each year — this includes residential, commercial, industrial, land, and business personal property.
Exemption Administration
The district processes and administers various property tax exemptions, including homestead exemptions, over-65 exemptions, disability exemptions, and veterans’ exemptions, among others.
Appraisal Records Maintenance: FBCAD maintains comprehensive records of all property within the county, including ownership information, property characteristics, and valuation history.
Appeals Process Management: The district oversees the property value protest process, allowing property owners to challenge their appraised values through informal meetings and formal hearings before the Appraisal Review Board (ARB).
Tax Roll Certification
After completing the appraisal and appeals processes, FBCAD certifies the appraisal roll to the various taxing entities within Fort Bend County, which then use these values to set their tax rates and collect property taxes.
Organizational Structure and Governance
The Fort Bend Central Appraisal District operates under a specific governance structure designed to ensure fair representation of the county’s taxing entities:
Board of Directors
FBCAD is governed by a board of directors. Five of the directors are appointed by the taxing units that participate in the district. Three directors are popularly elected, and the final director is the elected tax assessor-collector. This board approves the reappraisal plan, approves the district’s budget, and hires the chief appraiser and ARB members.
Chief Appraiser
As the chief administrative officer of the appraisal district, the chief appraiser oversees all operations, including property appraisals, exemption processing, and staff management.
Appraisal Review Board (ARB): This independent board of citizens appointed by the district’s board of directors resolves disputes between property owners and the appraisal district.
Professional Staff: FBCAD employs professional appraisers, data analysts, mappers, customer service representatives, and administrative staff to carry out its daily operations and responsibilities.
Appraisal Methodology & Standards
The Fort Bend Central Appraisal District adheres to specific methodologies and standards in its appraisal process:
- Market Value Approach: Texas law requires properties to be appraised at their market value as of January 1st each year. Market value is defined as the price a property would sell for on the open market.
- Mass Appraisal Techniques: Due to the large number of properties that must be valued each year, FBCAD utilizes mass appraisal techniques, which involve analyzing market data and applying standardized methods to groups of similar properties.
- Three Approaches to Value: The district employs three standard approaches to determine property values:
- Cost Approach: Estimating the cost to replace a property minus depreciation
- Market Approach: Comparing sales of similar properties
- Income Approach: Analyzing the income-generating potential of commercial properties
- Uniform Standards: FBCAD follows the Uniform Standards of Professional Appraisal Practice (USPAP) and standards established by the International Association of Assessing Officers (IAAO).
- Reappraisal Cycle: The district conducts reappraisals of all property in Fort Bend County every year to ensure values remain current with market conditions.
Relationship with Taxing Entities
The Fort Bend Central Appraisal District maintains important relationships with various taxing entities within the county:
Independent Role
While FBCAD determines property values, it does not set tax rates, impose a levy, or collect taxes. These functions are performed by the individual taxing entities.
Taxing Entities Served
FBCAD provides appraisal services for approximately 260 taxing entities within Fort Bend County, including:
- Fort Bend County
- Towns & Cities within Fort Bend
- School Districts
- Municipal Utility Districts (MUDs)
- Emergency Services Districts
- Special Districts
- Information Sharing: The district provides certified appraisal rolls to these entities, which they use to calculate their tax rates based on their budget needs.
- Funding Mechanism: FBCAD’s operations are funded through assessments paid by the taxing entities it serves, with each entity’s contribution proportional to the tax dollars it levies.
Impact on Property Owners and the Real Estate Market
Impact on Property Owners & Real Estate Market
The Fort Bend Central Appraisal District’s activities have significant implications for property owners and the broader real estate market:
- Half of Tax Calculation: By establishing property values, FBCAD determines the base upon which property taxes are calculated, directly affecting property owners’ tax burdens; however, local government budgets continue to be the driving force behind individual tax levies.
- Market Transparency: Through its property valuation process, the district provides valuable data that contributes to transparency in the local real estate market.
- Appeals Mechanism: FBCAD’s protest process offers property owners a means to challenge valuations they believe are incorrect, ensuring accountability in the appraisal system.
- Exemption Administration: Exemptions can provide significant discounts to individual property owners.
The Fort Bend Central Appraisal District serves as a critical component in the property tax system, balancing its statutory obligation to appraise properties at market value with the need to ensure fairness and equity in the distribution of the tax burden among property owners. Its operations directly impact every property owner in Fort Bend County and play a significant role in shaping the county’s fiscal health and real estate market dynamics.
Introduction
This report serves as a resource for property owners, real estate professionals, policymakers, and investors, providing actionable insights into the current state of Fort Bend County’s real estate market. It is important to note that this report is not exhaustive but rather a summary of what the Fort Bend Central Appraisal District feels are the key market indicators. As appraisers, our role is to review transaction data and create models based on that data. We do not necessarily have a need to answer “Why?” but rather conduct statistical analysis on available data. This report is an attempt to answer the most common question we receive, “Why did my property value go up?”, by putting on an economist’s “hat” to provide insights into the underlying trends and factors affecting property values.
Purpose & Significance
The Fort Bend County real estate market represents a dynamic and evolving sector of the Greater Houston metropolitan area’s economy. As one of the fastest-growing counties in Texas and the United States, Fort Bend County’s real estate landscape offers valuable insights into broader economic trends, demographic shifts, and policy impacts.
This report synthesizes data from multiple authoritative sources and various economic research institutions. By analyzing these diverse data points, we aim to present a holistic view of the Fort Bend County real estate market that goes beyond simple statistics to identify underlying trends, challenges, and opportunities.
Key Market Drivers
Several interconnected factors are currently driving the Fort Bend County real estate market:
Population Growth & Demographic Shifts
Fort Bend County continues to experience significant population growth, with the U.S. Census Bureau estimating the county’s population at approximately 900,000 residents as of 2024, representing a 20% increase since the 2020 Census. This growth is driven by both domestic migration from other parts of Texas and the United States, as well as international immigration.
The county’s demographic composition is also evolving, with increasing diversity across racial, ethnic, and socioeconomic dimensions. Fort Bend County is now recognized as one of the most diverse counties in the United States, with substantial Asian, Hispanic, Black, and White populations. This diversity influences housing preferences, neighborhood development patterns, and property values throughout the county.
Economic Development & Employment Growth
The diversification of Fort Bend County’s economy beyond its historical agricultural base has created new employment centers and changed commuting patterns, directly impacting residential and commercial real estate demand. Key economic sectors driving growth include:
- Healthcare and life sciences
- Energy and petrochemicals
- Professional and business services
- Education
- Retail and hospitality
- Manufacturing and logistics
Major employers like Texas Instruments, Amazon, Methodist Sugar Land Hospital, and the various school districts provide stable employment bases that support housing demand across different price points.
Infrastructure Investment & Development
Significant infrastructure investments have shaped development patterns and property values throughout Fort Bend County:
- Transportation improvements, including expansions to the Grand Parkway (SH 99), Fort Bend Tollway, and various county roads
- Water and wastewater system expansions to accommodate growth
- Educational facilities, including new schools and campuses for Houston Community College and University of Houston
- Healthcare infrastructure, such as hospital expansions and new medical office developments
- Parks, trails, and recreational amenities that enhance quality of life and property values
These investments have opened new areas for development while also increasing the desirability and value of existing neighborhoods with improved connectivity and amenities.
Interest Rates & Mortgage Market Conditions
The mortgage interest rate environment has been a significant driver of real estate market activity. After reaching multi-decade highs in late 2023, mortgage rates have begun to moderate in 2025, influencing both buyer demand and seller behavior:
- Higher rates initially cooled the market from the frenzied pace seen during the pandemic years
- Recent rate moderation has begun to bring some buyers back into the market
- Rate fluctuations have created distinct buyer segments with different motivations and constraints
- Existing homeowners with low-rate mortgages face financial disincentives to sell, contributing to inventory constraints
Housing Supply & Development Patterns
The balance between housing supply and demand remains a critical market driver:
- New construction activity has been robust in master-planned communities like Sienna, Aliana, and Cross Creek Ranch
- Infill development and redevelopment are increasing in established areas like Sugar Land and Missouri City
- Supply chain challenges and labor shortages have impacted construction timelines and costs
- Lot availability and development costs influence new home pricing and market positioning
Regulatory Environment & Policy Changes
Local, state, and federal policies significantly impact the real estate market:
- Property tax legislation at the state level has altered the financial calculations for homeowners and investors
- Local zoning and development regulations shape what can be built and where
- Environmental regulations, particularly related to flooding after Hurricane Harvey, have influenced development patterns
- School district performance and policies affect residential property values and demand patterns
These key drivers interact in complex ways to create the current market conditions in Fort Bend County. Understanding these interactions is essential for interpreting current trends and anticipating future market movements.
Economic Overview in Fort Bend County
Based on the research from multiple authoritative sources, the following information outlines the economic landscape of Fort Bend County, Texas:
Industry Diversity
Fort Bend County boasts a diverse economic base with several key industries driving its growth and development:
Commercial Real Estate Segments
- Office Market: Approximately 12.4 million square feet of office space, with about 400,000 square feet under construction. Nearly 80% of the county’s office inventory is concentrated in the Sugar Land submarket, which serves as the primary hub for professional services and corporate offices.
- Medical Office Properties: Approximately 63% of the office construction pipeline consists of medical office properties, reflecting the growing demand for healthcare facilities in the area.
- Industrial and Flex Properties: Fort Bend County has become a hub for logistics and distribution due to its strategic location near Houston and major transportation corridors. Business parks like Park 8Ninety and Lakeview Business Park attract major companies like Amazon, Home Depot, and FedEx.
- Retail Market: The retail landscape is evolving toward mixed-use projects that integrate retail, office, and residential spaces. Developments like Sugar Land Town Square and the Imperial Market offer vibrant environments that attract residents and visitors.
- Multi-Family and Hospitality: Multi-family developments are clustered in key residential submarkets like Cinco Ranch, Richmond/Rosenberg, and Sugar Land/Missouri City, which are experiencing high population growth.
Key Industries
- Residential construction
- Engineering services
- Healthcare
- Energy
- Logistics and distribution
- Professional services
- Retail and commercial services
Employment Trends
Fort Bend County demonstrates strong employment metrics and workforce characteristics:
- Employment Statistics:
- 415,651 employed population in 2023
- 3.48% 1-year employment growth
- Low poverty rate of 7.18% (3.6% 1-year increase)
- Educational Attainment:
- 48% of adults have a bachelor’s degree or higher, leading the region
- Strong focus on educational development through collaboration between school districts and higher education institutions
- Workforce Development:
- Active collaboration between educational institutions and industries to meet workforce needs
- Emphasis on healthcare worker training to address shortages in the growing healthcare sector
Infrastructure Investment
Fort Bend County is experiencing significant infrastructure development to support its growing population and economy:
- Healthcare Facilities:
- Memorial Hermann’s $231 million expansion project in Sugar Land
- Addition of medical beds, neonatal unit, and expanded outpatient areas
- Commercial Development:
- Redevelopment of historical buildings, including the nearly 100-year-old Imperial Sugar Char House
- Mixed-use master planned developments like Austin Point, which will include 15 million square feet of planned commercial space
- Transportation Infrastructure:
- Strategic location near major transportation corridors
- Continued investment in road and highway infrastructure to support logistics and distribution industries
Population Growth
Fort Bend County is experiencing remarkable population growth, making it one of the fastest-growing counties in Texas and the United States:
- Current Population: According to the U.S. Census Bureau, Fort Bend County had a population of 958,434 as of July 1, 2024.
- Recent Growth:
- 16.5% population increase from April 2020 to July 2024
- 3.26% growth from 2022 to 2023 (from 832,607 to 859,721)
- The population has tripled since 2000
- Future Projections:
- Expected to reach 1.8 million residents by 2050, according to Woods & Poole estimates
- Demographic Diversity:
- The 5 largest ethnic groups in Fort Bend County are:
- White (Non-Hispanic): 29.8%
- Asian (Non-Hispanic): 21.6%
- Black or African American (Non-Hispanic): 20.3%
- Two+ (Hispanic): 10.3%
- White (Hispanic): 7.23%
- Fort Bend County is recognized as the most diverse county in Texas and the third most diverse in the nation.
- The 5 largest ethnic groups in Fort Bend County are:
Economic Indicators
Fort Bend County shows strong economic performance across various indicators:
- Income Levels:
- Median household income: $113,409 (2023)
- 3.11% 1-year growth in median household income from 2022 to 2023
- Property Values:
- Median residential sale price: ~$450,000 (2025)
- 4.28% 1-year growth in property values
- Business Climate:
- Favorable environment for business development and expansion
- Strategic location within the Houston metropolitan area
- Business-friendly policies and regulations
Impact on Real Estate Market
The economic factors above have significant implications for Fort Bend County’s real estate market:
- Commercial Real Estate Diversity:
- Multi-family and flex & industrial properties dominate the market, representing 28.8% and 27.9% of total square footage, respectively
- Retail spaces make up 25.3% of the inventory
- Office properties account for 7.4% of the total inventory
- Specialty properties (6%), healthcare facilities (2.2%), and hospitality properties (1.9%) serve specific market segments
- Construction Activity:
- Multi-family construction leads with over 3 million square feet
- Flex & industrial properties follow closely
- Specialty, retail, and office spaces are also under development, albeit at lower levels
- Market Dynamics:
- Increasing demand for housing options due to population growth
- Growing need for industrial and logistics facilities
- Evolution toward mixed-use developments that integrate multiple property types
- Expansion of healthcare facilities to serve the growing population
The economic landscape of Fort Bend County is characterized by diversity, growth, and strategic development, creating a robust foundation for its real estate market and continued prosperity.
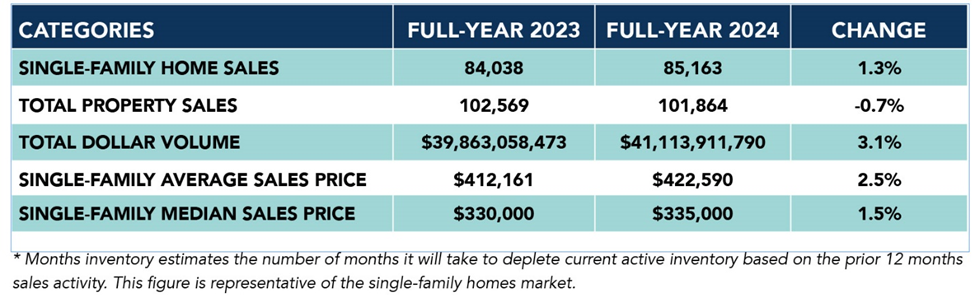
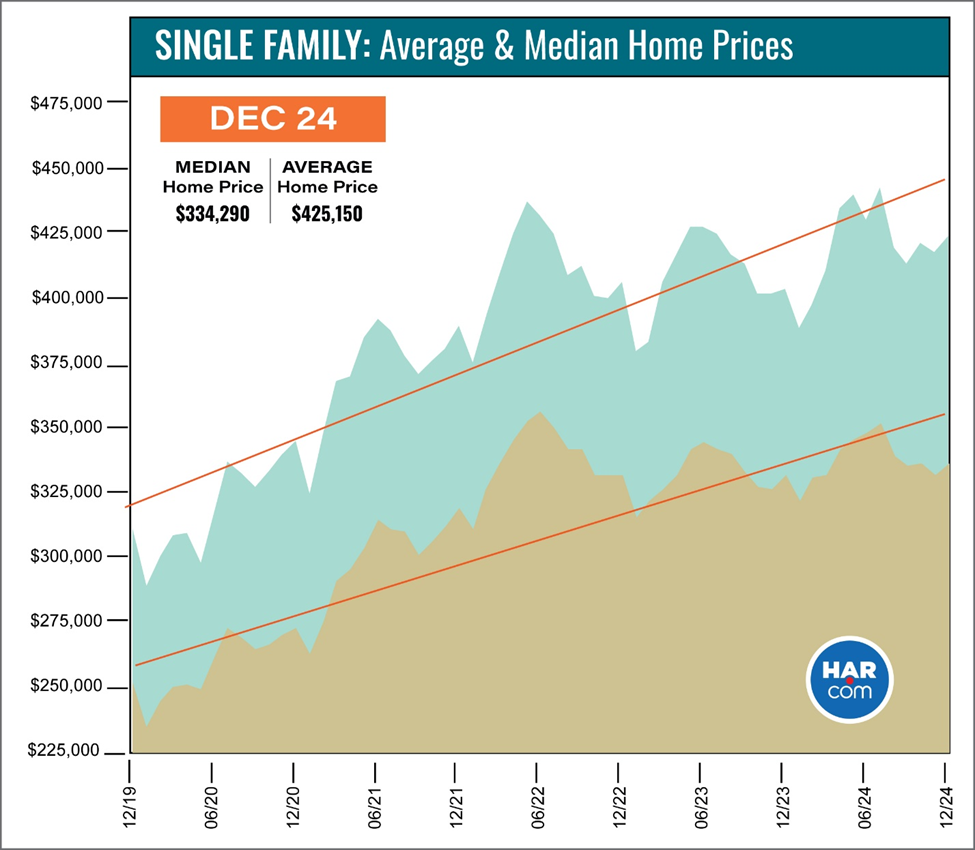
Housing Market Trends in Fort Bend County
Median Home Prices
Fort Bend County’s housing market has shown mixed price trends in recent months:
- Current Median Sale Price:
- Median sale price for residential homesteaded property in urban markets: $468,442 (FBCAD)
- Median sale price for residential homesteaded property in rural markets: $442,234 (FBCAD)
- According to Redfin data, the median sale price in Fort Bend County was $362,775 for all residential property in February 2025, representing a 4.4% decrease compared to the same period last year.
- The median price per square foot in Fort Bend County is $166, up 1.2% since last year.
- Listing Price vs. Sale Price:
- Federal Reserve Economic Data (FRED) shows the median listing price in Fort Bend County at $423,223 as of February 2025.
- The gap between listing and sale prices indicates potential negotiation room in the current market.
- Price Trends by Housing Segment:
- According to the Houston Association of Realtors (HAR), different price segments are performing differently:
- Homes priced between $150,000 and $249,999 saw a 2.0% increase in sales
- Luxury homes ($1 million+) experienced a 1.9% increase in transactions
- Mid-range homes ($250,000 – $999,999) saw decreases in sales activity
- This suggests a bifurcated market with strength at both the affordable and luxury ends.
- According to the Houston Association of Realtors (HAR), different price segments are performing differently:
- Historical Context:
- FRED data shows that median listing prices have fluctuated significantly since 2016, with a sharp increase during 2020-2022, followed by a period of stabilization and slight decline.
- Current prices remain significantly higher than pre-pandemic levels despite recent cooling.
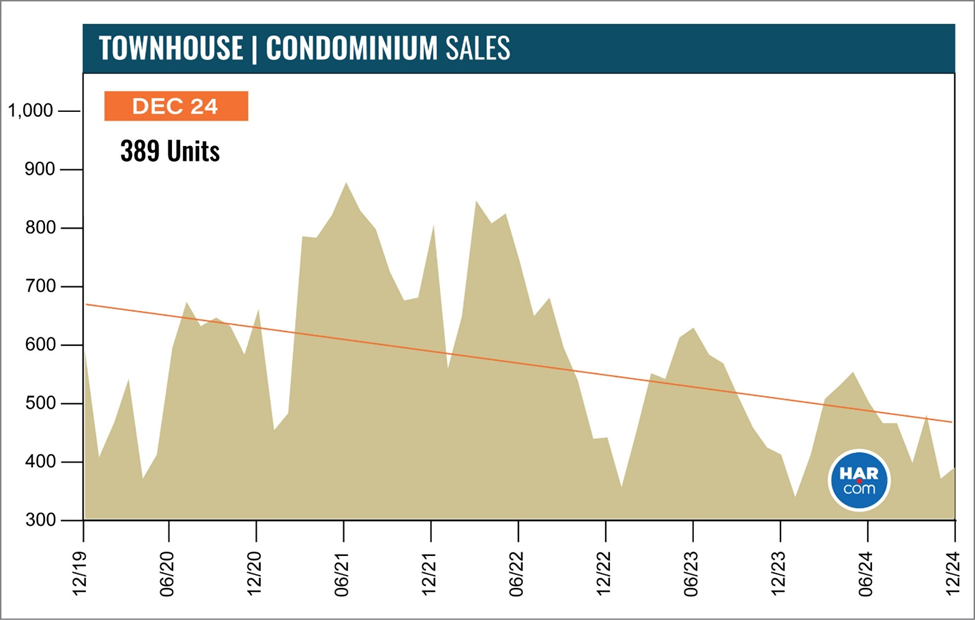
Inventory Levels
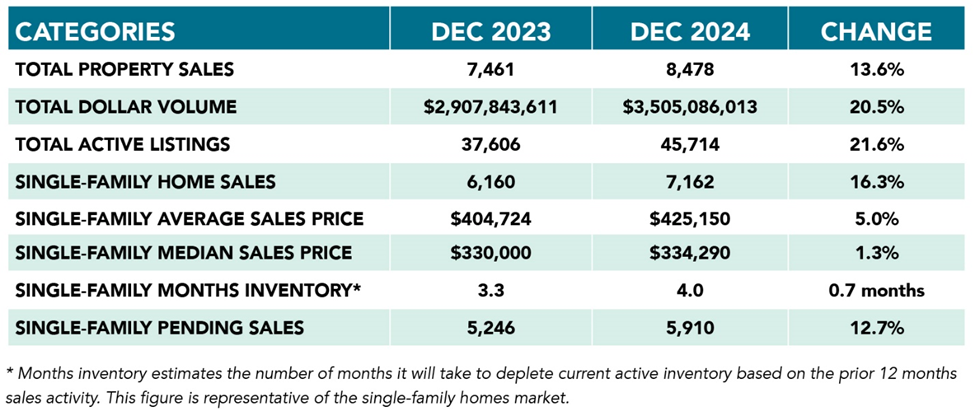
Fort Bend County is experiencing a significant shift in housing inventory:
- Current Inventory:
- Active listings in the Greater Houston area, which includes Fort Bend County, reached 31,112 in February 2025.
- This represents a 33.7% increase compared to February 2024 levels.
- According to HAR, this is the highest volume of available homes since July 2011 when there were 32,096 units.
- Months of Inventory:
- The months of inventory in the area has increased to 4.4 months from 3.3 months in February 2024.
- This indicates a shift toward a more balanced market compared to the seller’s market conditions of recent years.
- For context, the national supply stands at 3.5 months, according to the National Association of Realtors.
- Inventory by Property Type:
- Single-family homes dominate the inventory.
- Townhomes and condominiums have seen inventory expand from a 3.9-months supply in February 2024 to 6.2-months in February 2025, the highest level since June 2012.
New Construction Trends
New construction activity in Fort Bend County continues to respond to market demands:
- Construction Activity:
- Based on Partners Real Estate data, multi-family construction leads with over 3 million square feet under development.
- Residential construction remains one of the key industries in Fort Bend County’s economic base.
- Development Patterns:
- New construction is clustered in key residential submarkets like Cinco Ranch, Richmond/Rosenberg, and Sugar Land/Missouri City.
- Mixed-use master-planned developments like Austin Point are emerging as significant contributors to new housing stock.
- Future Projections:
- With Fort Bend County’s population expected to reach 1.8 million by 2050, continued new construction will be necessary to meet housing demands.
- The current inventory expansion suggests builders are responding to anticipated future needs.
- By the Numbers:
Sales Activity
The Fort Bend County housing market is showing signs of cooling in terms of transaction volume:
According to HAR Chair Shae Cottar, “We are seeing a shift to a more balanced market, arguably a buyer’s market, which offers more opportunities for those looking to purchase a home.”
Current Sales Volume:
According to Redfin, there were 818 homes sold in Fort Bend County in February 2025, down 7.0% from 880 homes in February 2024.
HAR reports that single-family home sales across the Greater Houston area declined 3.0% year-over-year in February 2025.
Days on Market:
Homes in Fort Bend County are taking longer to sell, with the median days on market increasing to 51 days in February 2025, compared to 49 days a year earlier.
HAR data for the Greater Houston area shows days on market increased from 58 to 59 days.
Market Dynamics:
The cooling in sales activity is attributed to economic conditions, including elevated mortgage rates and inflation concerns.

Source: Houston Association of Realtors
Property Types
Different property types in Fort Bend County are experiencing varying market conditions:
The inventory of townhomes and condominiums has expanded significantly, reaching a 6.2-months supply.
- Single-Family Homes:
- Single-family homes continue to dominate the market in terms of both inventory and sales representing approximately 75% of all property in Fort Bend County.
- Existing home sales totaled 3,876 in February 2025 across the Greater Houston area, down 4.1% compared to the same time last year.
- Townhomes and Condominiums:
- This segment has experienced a significant decline in sales, with HAR reporting a 21.9% year-over-year decrease in February 2025.
- Despite the sales decline, prices have increased, with the average price rising 11.0% to $287,746 and the median price increasing 4.4% to $248,500.
- The inventory of townhomes and condominiums has expanded significantly, reaching a 6.2-months supply.
Source: Houston Association of Realtors
- Luxury Properties:
- The luxury segment ($1 million+) has shown resilience with a 1.9% increase in transactions.
- This segment appears less susceptible to interest rate fluctuations compared to mid-range properties.
Impact on Property Values Assessment
The current housing market trends have several implications for property values assessment:
Residential increasing slightly while commercial relatively flat with some segment specific declines in value.
- Assessment Challenges:
- The cooling market with declining median prices (-4.4% year-over-year according to Redfin) has led to smaller increases in value; however, homestead caps are still increasing 10% for many property owners due to large increases over the last few years.
- The gap between listing prices and sale prices suggests potential overconfidence in some segments.
- Valuation Methodology:
- The Fort Bend Central Appraisal District uses prior year market data to determine property values.
- The Texas Constitution requires properties to be valued at 100% of their market value, so the recent price action is reflected in assessments.
- Market Segmentation:
- Different performance across price segments (with strength in both affordable and luxury segments) may lead to varied assessment impacts.
- Residential increasing slightly while commercial relatively flat with some segment specific declines in value.
Property Values Assessment
The Fort Bend Central Appraisal District (FBCAD) assesses property values using a comprehensive approach that integrates recent sales data, prevailing market trends, and specific property characteristics (FBCAD, 2025). This methodology ensures valuations are equitable and reflective of current market conditions in Fort Bend County. For the 2025 tax year, the FBCAD’s proposed notice values indicate a moderate increase across various property categories, driven by robust demand, new construction, and regional growth patterns.
Residential Property Values
Residential property values have also risen, with distinct differences between urban and rural markets. In 2025, the average sale price in urban markets increased by 5.17% from $445,420 in 2024 to $468,442, while rural markets saw a sharper 10.79% rise from $399,160 to $442,234 (FBCAD, 2025). This suggests faster appreciation in rural areas, potentially driven by demand for space and new developments. Countywide, the total proposed market value for residential properties grew from $123.38 billion in 2024 to $125.47 billion in 2025, approximately 1.7%, with Lamar CISD showing the largest jump from $32.91 billion to $34.87 billion (FBCAD, 2025).
Commercial Property Values
Commercial property values vary significantly by school district, reflecting localized economic activity and development. Katy ISD leads with the highest total proposed market value for 2025 at $27.58 billion, comprising $13.55 billion in land value and $11.41 billion in building value (FBCAD). This dominance is partly due to new construction, including retail and office condominiums, which signal a recovery in the commercial sector (FBCAD, 2025). However, income properties show mixed trends: multi-family properties declined by 6%, offices by 10%, and retail by 8% on a notice-to-notice basis, while distribution warehouses saw a modest 2% decrease, supported by projects like Trammell Crow’s 1.35 million square foot industrial park in Missouri City (FBCAD, 2025).
Land Values
Land values in Fort Bend County have experienced consistent growth, with the total proposed land value for 2025 reaching $39 billion, a 5.12% increase from $37 billion in 2024 (FBCAD, 2025). This rise is underpinned by trends in vacant land sales, particularly in rural areas, where the average sales price surged by 28% from 2023 to 2024, compared to a 24% increase in urban areas (FBCAD, 2025). The disparity highlights stronger appreciation in rural markets, possibly due to demand for larger tracts, with prices ranging from $20,000 to $30,000 per acre in rural zones versus $70,000 per acre in high-demand areas like Rosenberg and Katy (FBCAD, 2025).
Impact of New Construction and Development
New construction is a pivotal factor influencing property values. In 2024, Fort Bend County added 7,691 new homes, with Lamar ISD contributing 5,292 (FBCAD, 2025). Ongoing large-scale projects, such as Austin Point (4,700 acres, opening 2025), Indigo (235 acres, first residents by March 2025), and Brookewater (850 acres, 2,500 homes), are set to further expand housing supply (FBCAD, 2025). These developments are likely to stabilize prices in high-demand areas by increasing inventory, while boosting values in emerging neighborhoods.
Reducing Your Property Tax Burden
Homestead Exemption
The homestead exemption remains the easiest way to reduce your property taxes by as much as 20%.
We want every property owner to be fully informed as to the various ways they can reduce their property tax burden.
Beyond that, you may be eligible for the over 65, disability, or veterans among others.
In 2020, FBCAD launched a new online exemptions portal that allows for remote submission of exemptions applications and emailed status updates.
The portal can be accessed by visiting https://www.fbcad.org/exemption-application/
Also, a full list of exemptions can be found at www.fbcad.org/fbcad-forms/ under “Homestead Exemptions” and “Miscellaneous Exemptions”
If you want to check to see what exemptions are associated with your property, please search for your account on our website at https://esearch.fbcad.org/
Please note that Texas law prohibits the appraisal district from displaying certain information in order to protect your privacy.
Our Information and Assistance team is on standby to address any exemption questions you may have. Reach them by phone at 281-344-8623 or send an email to info@fbcad.org
Appeals
We have made significant changes to make the online appeals process more transparent and user-friendly.
The value appeal process provides another avenue for reducing your property’s value, which may reduce your overall tax burden. You know your property best and may have additional information specific to your property or market area that supports a change in value. For this reason, the state legislature created the protest process to officially appeal the value set by the appraisal district. For more information, please visit the “Appeals” section of this website at www.fbcad.org/appeals/
Appealing your value can be a nerve-racking experience. Recognizing this, the Texas Comptroller has produced a set of videos that provide an overview of the protest process for individual homeowners and small businesses. The videos also cover the most common situations that arise in a protest hearing. We host these videos here at www.fbcad.org/property-tax-videos/
Recent Legislation Limits Tax Increases
Senate Bill 2: The Property Tax Relief Act
The Texas Legislature passed Senate Bill 2, known as the “Property Tax Relief Act,” during the 2023 legislative session. While portions of this legislation have already taken effect, several important provisions become effective in January 2025:
Governance Restructuring: Central appraisal districts with populations of more than 75,000 now have a fixed nine-member board consisting of 3 popularly elected members, 5 appointed members, and the tax-assessor collector. The CAD BOD is also now responsible for hiring individual ARB members.
Circuit Breaker Limits: Starting January 1, 2024, SB 2 implements a 20% “circuit breaker” limit on increases to the appraised value of non-homestead properties valued at $5 million or less. This provision aims to protect property owners from dramatic year-over-year increases in property valuations.
Increased School Tax Exemption: The general homestead exemption for school taxes increased from $40,000 to $100,000, resulting in significant savings for homeowners on their school district tax bills.
School District Funding Adjustments: To compensate for the loss of tax revenue caused by restrictions on tax increases for elderly and disabled homeowners, SB 2 allows school districts to request additional state funding if they encounter budget shortfalls.
Summary
The Fort Bend County real estate market is experiencing a significant transition period characterized by moderating prices, increasing inventory, and evolving buyer and seller behaviors. This summary analysis has examined the multifaceted factors influencing the local real estate landscape, from economic drivers to legislative changes, providing stakeholders with essential insights for navigating this dynamic market.
Sources
Government
Fort Bend County. (2025) . “Homestead Exemption.” Retrieved from https://www.fortbendcountytx.gov/government/departments/tax-assessor-collector/homestead-exemption
Fort Bend County. (2025) . “Property Taxes.” Retrieved from https://www.fortbendcountytx.gov/government/departments/tax-assessor-collector/property-taxes
Fort Bend County Levee Improvement District No. 2. (2025) . “2024 Tax Update: FBCLID 2 continues to lower tax rate.” Retrieved from https://www.fbclid2.com/general/2024-tax-update-fbclid-2-continues-to-lower-tax-rate/
Texas Comptroller of Public Accounts. (2024) . “Appraisal Protests and Appeals.” Retrieved from https://comptroller.texas.gov/taxes/property-tax/protests/index.php
U.S. Census Bureau. (2024) . “QuickFacts: Fort Bend County, Texas.” Retrieved from https://www.census.gov/quickfacts/fact/table/fortbendcountytexas/PST045224
Real Estate Market Data
Federal Reserve Bank of St. Louis. (2025) . “Housing Inventory: Median Listing Price in Fort Bend County, TX (MEDLISPRI48157).” FRED Economic Data. Retrieved from https://fred.stlouisfed.org/series/MEDLISPRI48157
Houston Association of Realtors. (2025, March 15) . “HAR: Area home sales cool in February.” Fort Bend Star. Retrieved from https://www.fortbendstar.com/business_real_estate/har-area-home-sales-cool-in-february/article_00bb4adc-019d-11f0-87ad-2348f1d3cdeb.html
Redfin. (2025) . “Fort Bend County, TX Housing Market: House Prices & Trends.” Retrieved from https://www.redfin.com/county/2718/TX/Fort-Bend-County/housing-market
Zillow. (2025) . “Fort Bend County Home Values.” Retrieved from https://www.zillow.com/home-values/2698/fort-bend-county-tx/
ATTOM Data Solutions. (2025) . “Fort Bend County, TX Real Estate Data.” Retrieved from https://www.attomdata.com/data/us-real-estate/tx/fort-bend-county/
Orchard. (2025) . “Fort Bend County Real Estate Market Report.” Retrieved from https://orchard.com/homes/real-estate-market-report/county/tx/fort-bend
News and Analysis
CBS Texas. (2025, January 1) . “New Texas tax regulations are taking effect in 2025. Here’s how they may affect you.” Retrieved from https://www.cbsnews.com/texas/news/texas-tax-regulations-laws-2025/
ABC13 Houston. (2024, December 30) . “Texas laws: Here’s what’s changing with property taxes, vehicle inspections and more in January 2025.” Retrieved from https://abc13.com/post/texas-laws-heres-whats-changing-property-taxes-vehicle-inspections-more-january-2025/15729888/
Fountain, K. (2024, September 30) . “Fort Bend commissioners approve increased budget with lower tax rate.” Fort Bend Star. Retrieved from https://www.fortbendstar.com/countynews/fort-bend-commissioners-approve-increased-budget-with-lower-tax-rate/article_a2e30f92-7f71-11ef-8147-fb85826418ce.html
Austin American-Statesman. (2024, December 30) . “These 6 Texas laws will go into effect Jan. 1, 2025.” Retrieved from https://www.statesman.com/story/news/state/2024/12/30/2025-texas-laws-new-year-taxes-data-privacy-vehicle-inspections/77084005007/
Economic Data and Analysis
Data USA. (2024) . “Fort Bend County, TX Profile.” Retrieved from https://datausa.io/profile/geo/fort-bend-county-tx
Fort Bend County Economic Development Council. (2024) . “Economic Forecast.” Retrieved from https://fortbendcounty.com/why-ft-bend/economic-forecast
Greater Houston Partnership. (2024) . “Fort Bend County identifies key elements to sustain future growth.” Retrieved from https://www.houston.org/news/fort-bend-county-identifies-key-elements-sustain-future-growth
Partners Real Estate. (2024) . “Market Edge: A Strategic Hub for Growth.” Retrieved from https://partnersrealestate.com/research/market-edge-a-strategic-hub-for-growth/
Property Tax Services
HAR.com. (2024) . “Protesting Your Fort Bend County Property Taxes.” Retrieved from https://www.har.com/blog_23149_protesting-your-fort-bend-county-property-taxes